
Diabetes Statistics: Facts & Latest Data in the US (2024 Update)


Report Highlights:
- 37.3 million Americans (all ages) or 11.3% of the US population have diabetes, 37.1 million of which are adults 18 and older [7].
- Type 2 diabetes makes up 90.9% or 21 million of all diabetes cases in the country [4].
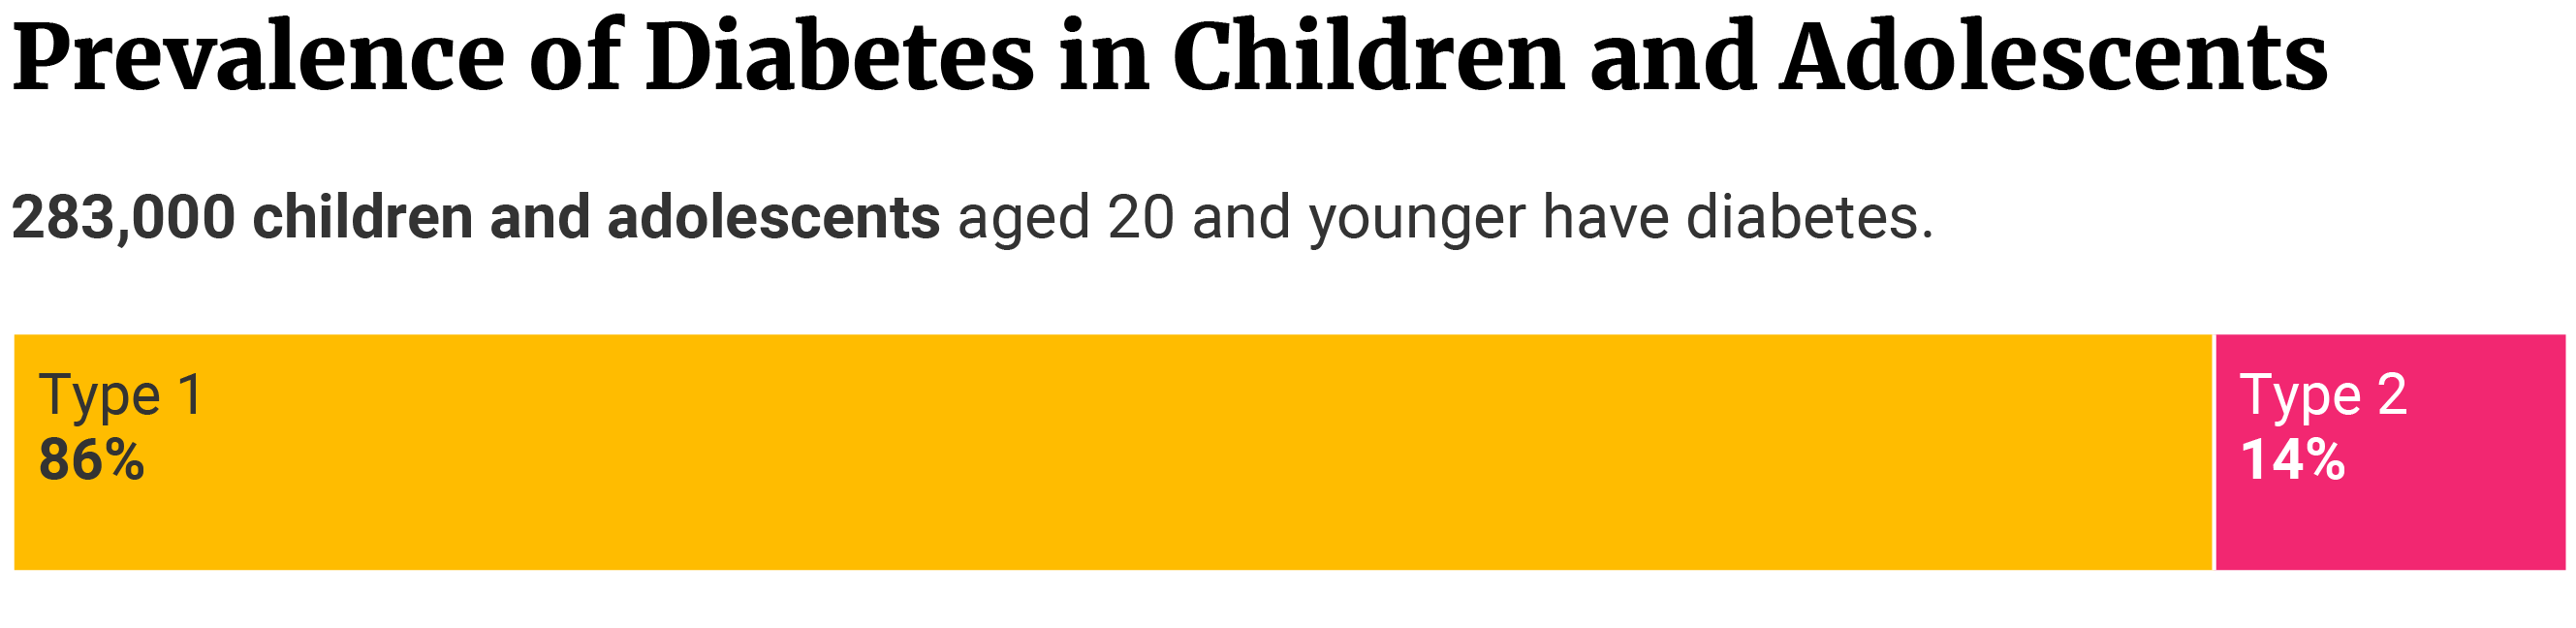
- 283,000 American children and adolescents (less than 20 years of age) have diabetes, 86.2% of which have type 1 diabetes [8].
- 2% to 10% of all pregnancies in the US suffer from gestational diabetes [14].
- 38%, 96 million, or nearly 2 in 5 Americans have prediabetes [6].
- Nearly 1 in 4 don’t know they have diabetes, and 4 in 5 don’t know they have prediabetes [7] [31].
- 11.8% of men and 11% of women from CDC’s 2021 sample size of 437,708 people have diabetes [3].
- From CDC’s sample size, diabetes is highest among older people aged 75 to 79 at 25.7% [3].
- Diabetes occurred the most among Black Americans, affecting 15.5% of their population in CDC’s sample size [3].
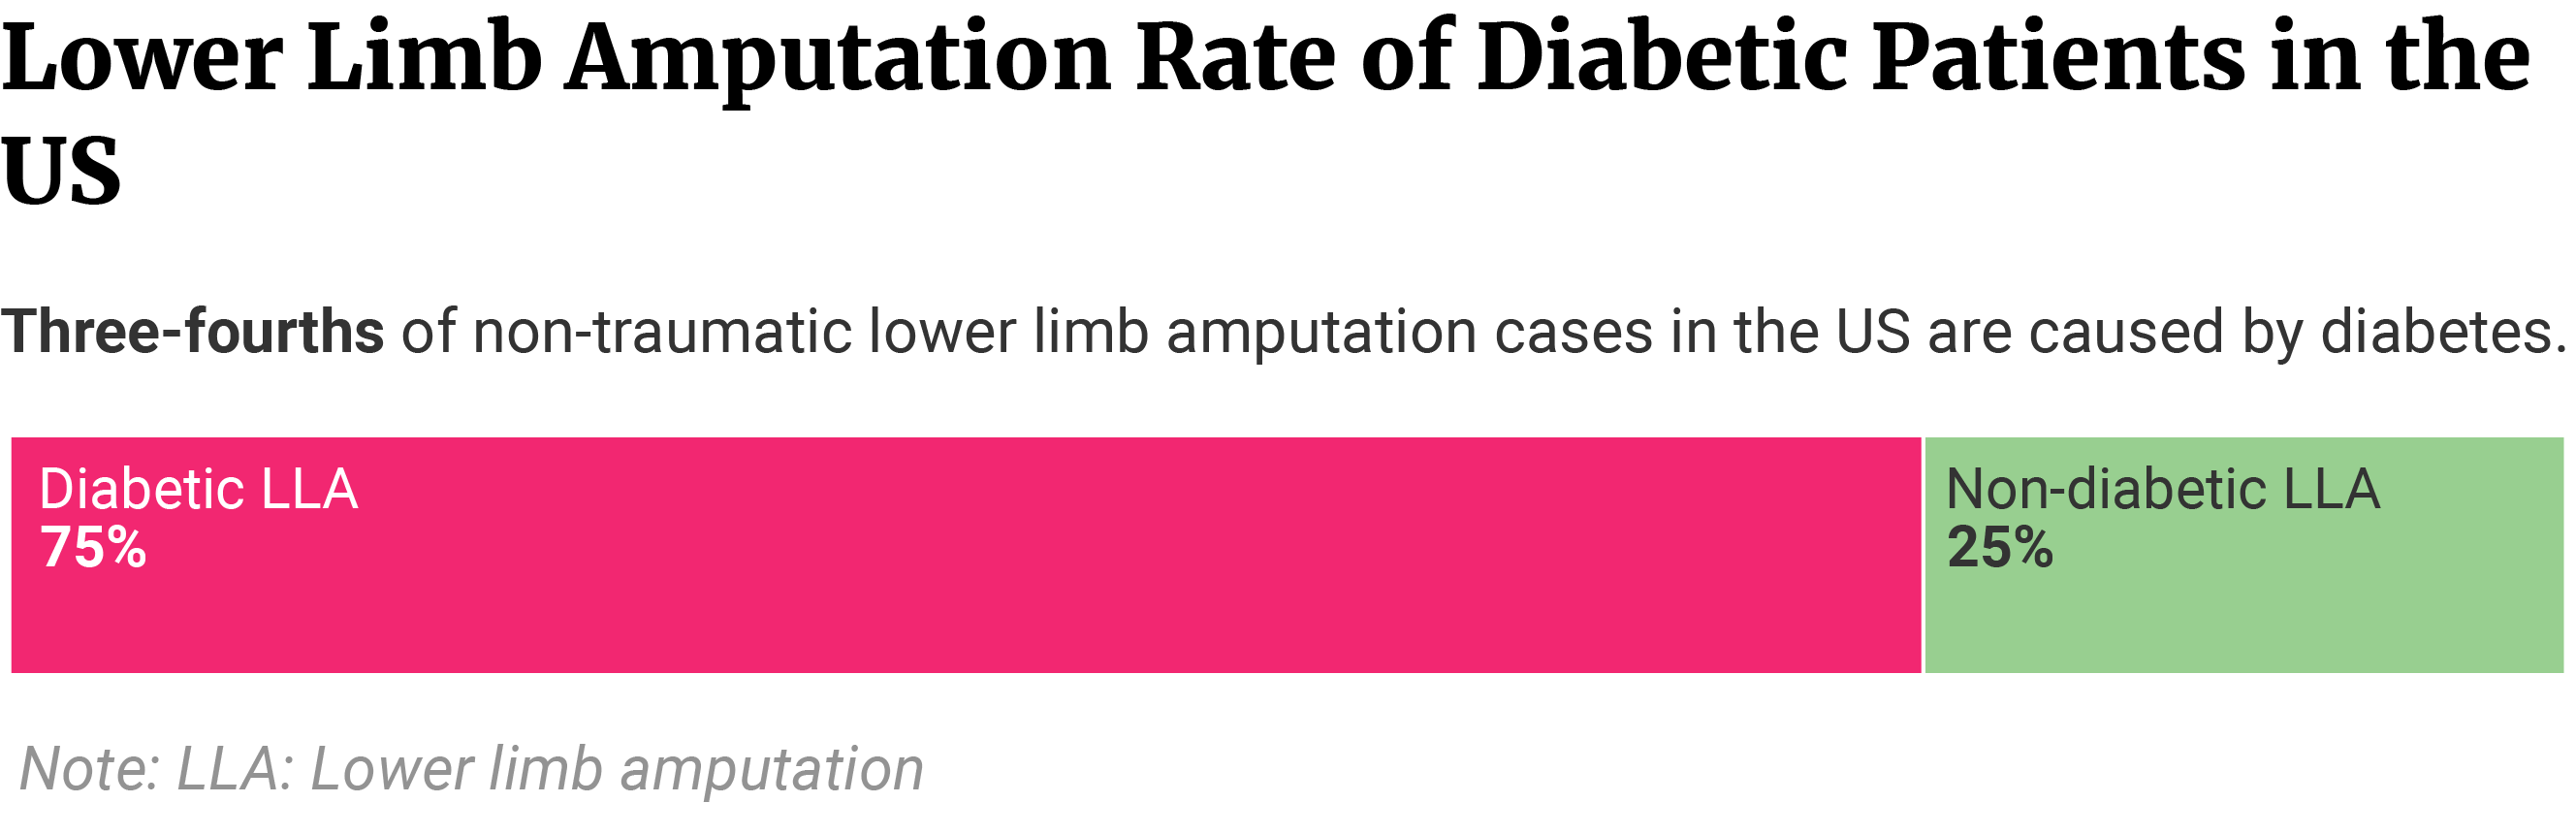
- 75% of non-traumatic lower-extremity amputation cases in the US are caused by diabetes [13].
- Diabetes is the 8th leading cause of death in 2020. In 2019, it ranked 7th [5].
- The median number of diabetes deaths per year is 73,882 [5].
- 80.91% of diabetes deaths in 2020 are older people aged 60 and above [5].
- Diabetes cost the US $327 billion in 2017, 72.5% (237 billion) of which went to direct medical costs [2].
- Diabetics spend 2.3 times more on healthcare than non-diabetics [2].
Insulin helps regulate blood glucose levels and carries it into the cells. The cells, in turn, use glucose for energy production. In diabetes, the body either can’t produce enough insulin or use insulin properly.
The normal blood glucose and A1C levels are less than 140 mg/dl and 5.7%, respectively. According to the American Diabetes Association, an A1c level of more than 6.5% and a blood glucose level equal to or greater than 200 mg/dl warrants a diabetes diagnosis [10].
The National Diabetes Statistics 2019 report showed that about 1 in 9 Americans has diabetes [7]. The number of Americans diagnosed with diabetes has more than doubled in two decades [11].
Is it growing? Read on to discover the current diabetes statistics in the US.
Most Common Type of Diabetes
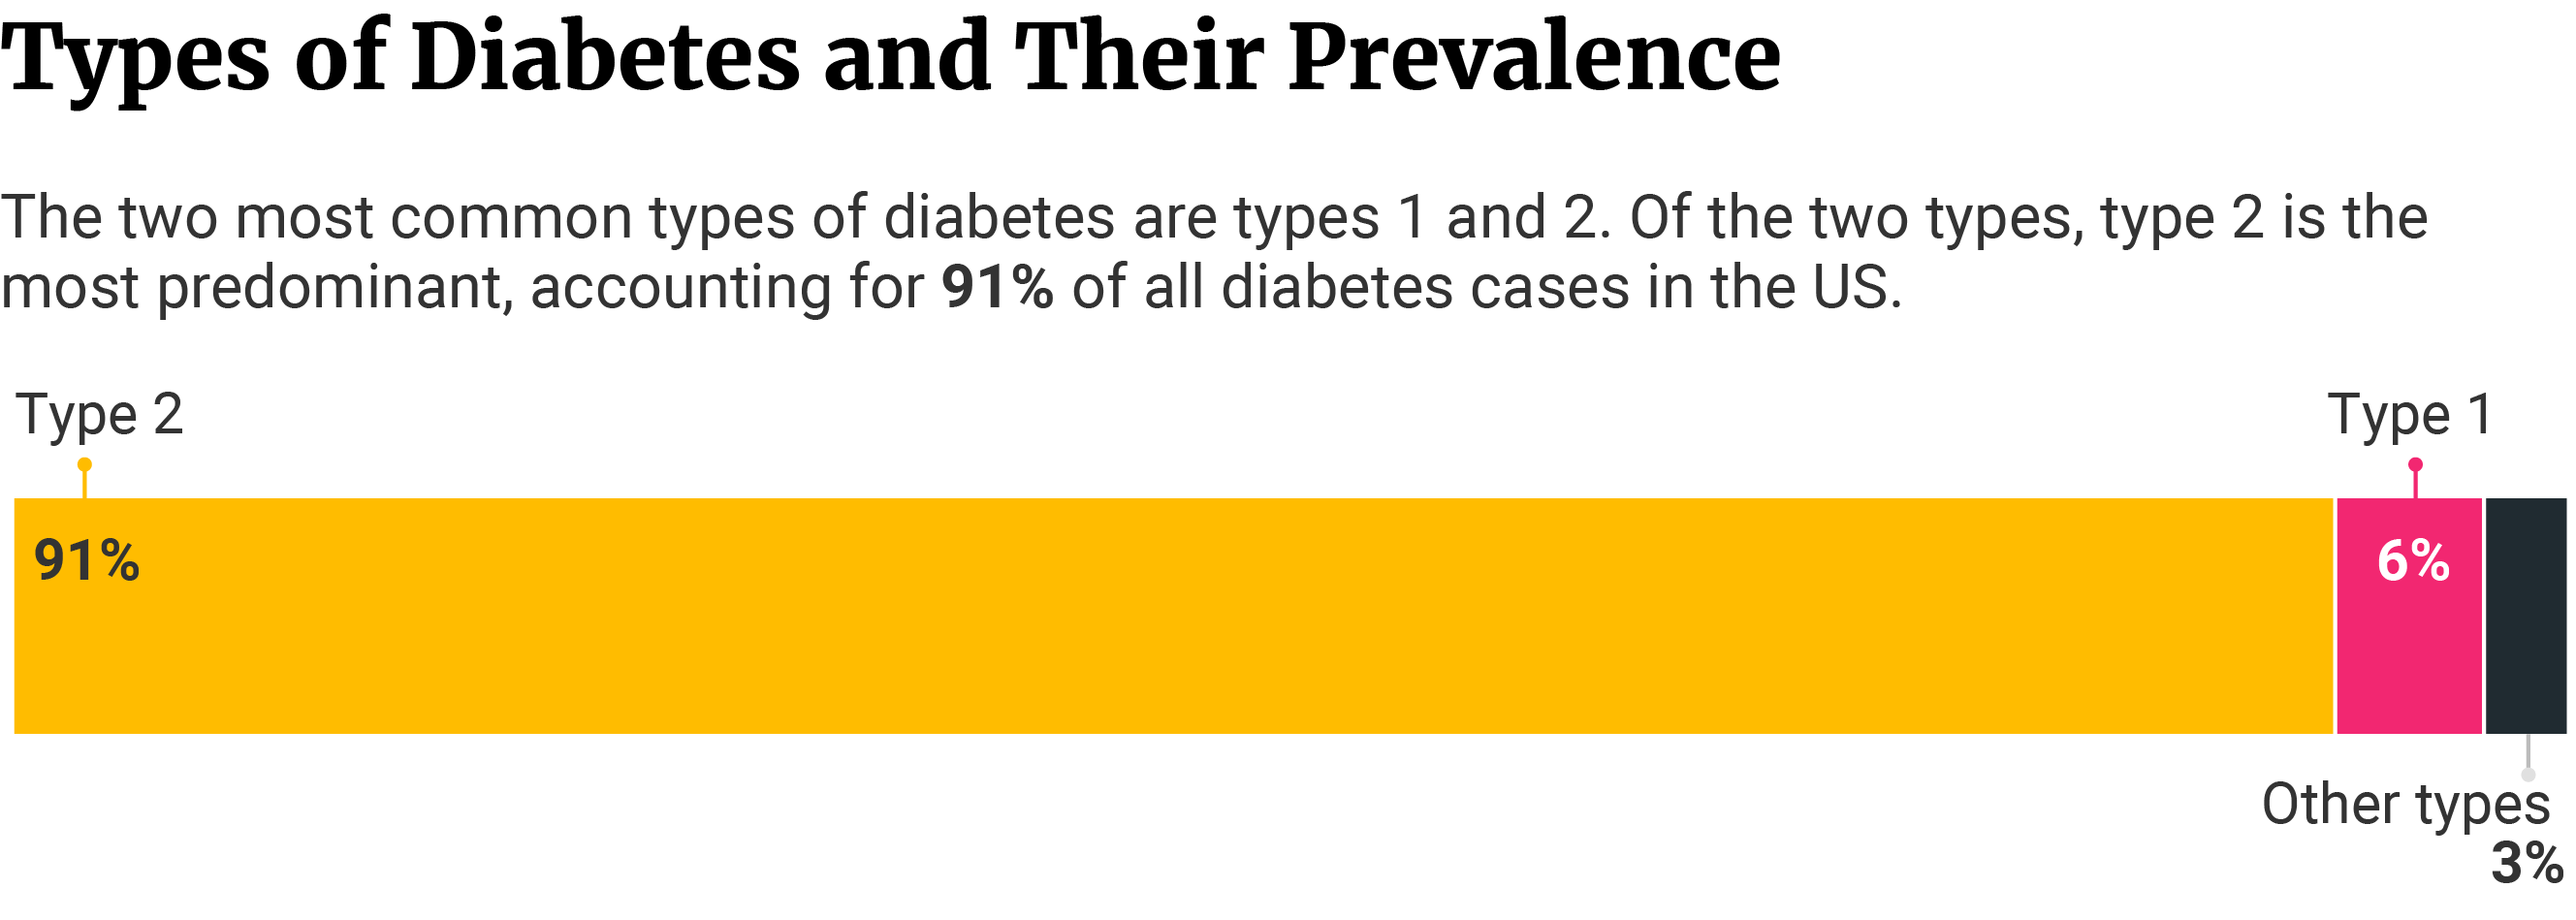
The most common type of diabetes is type 2 diabetes, making up 90.9% of all diabetes cases [4].
5.8% have type 1 diabetes. It’s the second most common type of diabetes [4].
Other types of diabetes make up 3.3% of all diabetes cases. These include gestational diabetes and neonatal diabetes [4].

How Many People Have Type 1 Diabetes?
0.55% or 1.3 million American adults suffer from type 1 diabetes [4].
![]()

A type of autoimmune disease, type 1 diabetes attacks the pancreatic B cells. These are special cells in the pancreas that produce insulin.
Type 1 diabetes can develop at any age. However, it typically starts in childhood.
How Many People Have Type 2 Diabetes?
8.58% or 21 million American adults suffer from type 2 diabetes [4].
![]()

Type 2 diabetes can also start at any age. However, unlike type 1 diabetes, it typically starts in adulthood. It also isn’t an autoimmune disorder but is caused by lifestyle choices.
- Being overweight or obese increased risk by 81% in adults and 32.1% in children [12].
- Poor diet high in sugar and carbohydrates increased risk by 30% [30].
- Sedentary lifestyle increased risk by 13% [27].
How Common is Gestational Diabetes?
Each year, gestational diabetes affects 2% to 10% of pregnancies in the country. This typically develops when the pregnant woman is around 24 weeks of pregnancy [14].
![]()

According to the Centers for Disease Control and Prevention, the overall rate of gestational diabetes in the US is 7.8 per 100 births [16].
From 6% in 2016, the rate has increased by 30% to 7.8% in 2020. The number of pregnant women with gestational diabetes also increased by 20%. From 234,847 in 2016, it increased to 281,789 in 2020 [16].
How Many People Have Prediabetes?
Prediabetes affects 38% of the population or nearly 2 in 5 Americans. This translates to 96 million American adults (18 and older) [6].
![]()

Of those with prediabetes, over 80% or more than 4 in 5 don’t know they’re prediabetic [31].
Doctors also sometimes call prediabetes impaired glucose tolerance. Being diagnosed with prediabetes doesn't mean you're already diabetic though. It simply means you have a higher-than-normal blood glucose level. However, the value isn’t enough to warrant a diabetes diagnosis.
Diabetes Prevalence: How Many People Have Diabetes?
CDC’s data showed that 23.4 million Americans have been diagnosed with diabetes in 2019 [11].
However, 2019 crude estimates show the numbers could be higher. Diabetes may have affected 11.3% or 37.3 million Americans of all ages that year [7].
37.1 million of them are adults aged 18 or older. They make up 14.7% of the country’s adult population [7].
- 11.3% or 28.5 million of them have diagnosed diabetes.
- 3.4% or 8.5 million have undiagnosed diabetes.
22.9% or nearly 1 in 4 diabetics don’t know they have diabetes.
Diabetes affects 283,000 American children and adolescents under the age of 20. 86.2% or 244,000 of them have type 1 diabetes [8].

Number of People with Diabetes Over Time
From 1999 to 2019, the number of American adults with diabetes has more than doubled [11].
Diabetes affected 10.9 million Americans in 1999. This rose to 23.4 million in 2019, a 114.7% increase in over two decades [11].
In 2009, the country breached its 20-million mark in diabetes cases with 20.5 million [11].
By 2025, the number of Americans with diabetes could increase to 53.1 million. 72.9% or 38.7 million will have been diagnosed with diabetes. 27.1% or 14.4 million could remain undiagnosed [32].
The age-adjusted prevalence rate of diagnosed and undiagnosed diabetes also increased over time.
Between 2001 and 2004, diabetes affected 10.3% of adults in the US. 7.1% of them received diabetes diagnosis, while 3.2% were undiagnosed [7].
Between 2017 and 2020, diabetes now affected 13.2% of the country’s adult population. 10.1% of them were diagnosed with diabetes, while 3.1% were not [7].
By 2025, 14.9% of the American population will have been diagnosed with diabetes [32].
Around 1.4 million Americans receive a diagnosis of diabetes each year [35]. This translates to one new diabetes case every 23 seconds.
Diabetes Demographics
Diabetes occurs the most in men at 11.8%, older people (75 to 79 years ) at 25.7%, and Black Americans at 15.5%.
It’s highest in West Virginia at 15.9% and lowest in Colorado at 7%.
Diabetes Prevalence Male vs Female
Based on CDC’s 2021 sample size of 437,708 people, diabetes affects men more at 11.8% than women at 11% [3].
Of this sample size, 28,196 of them are men, while 29,420 are women [3].
Diabetes Prevalence by Age
From the same sample size of 437,708, diabetes affects older people aged 75 to 79 the most at 25.7%. The disease occurs the least among young adults 18 to 24 years at 1.4% [3].
However, the age group with the highest number of diabetic individuals is older people aged 70 to 74. They make up 9,476 of the sample size [3].
On the other hand, the age group with the lowest number of diabetic individuals is young adults (18 to 24 years). They make up only 298 of the sample size [3].
Diabetes Prevalence by Race
Diabetes affects Black Americans the most, with 15.5% of their population in the sample size of 437,708 having diabetes [3].
The disease affects Asian Americans the least. Of their population in the sample size, only 9.6% of them have diabetes [3].
However, owing to their large population, White Americans make up the majority of the diabetes cases with 41,464 [3].
Native Hawaiian and Pacific Islander (NHPI) has the least number of diabetic individuals with 308 [3].
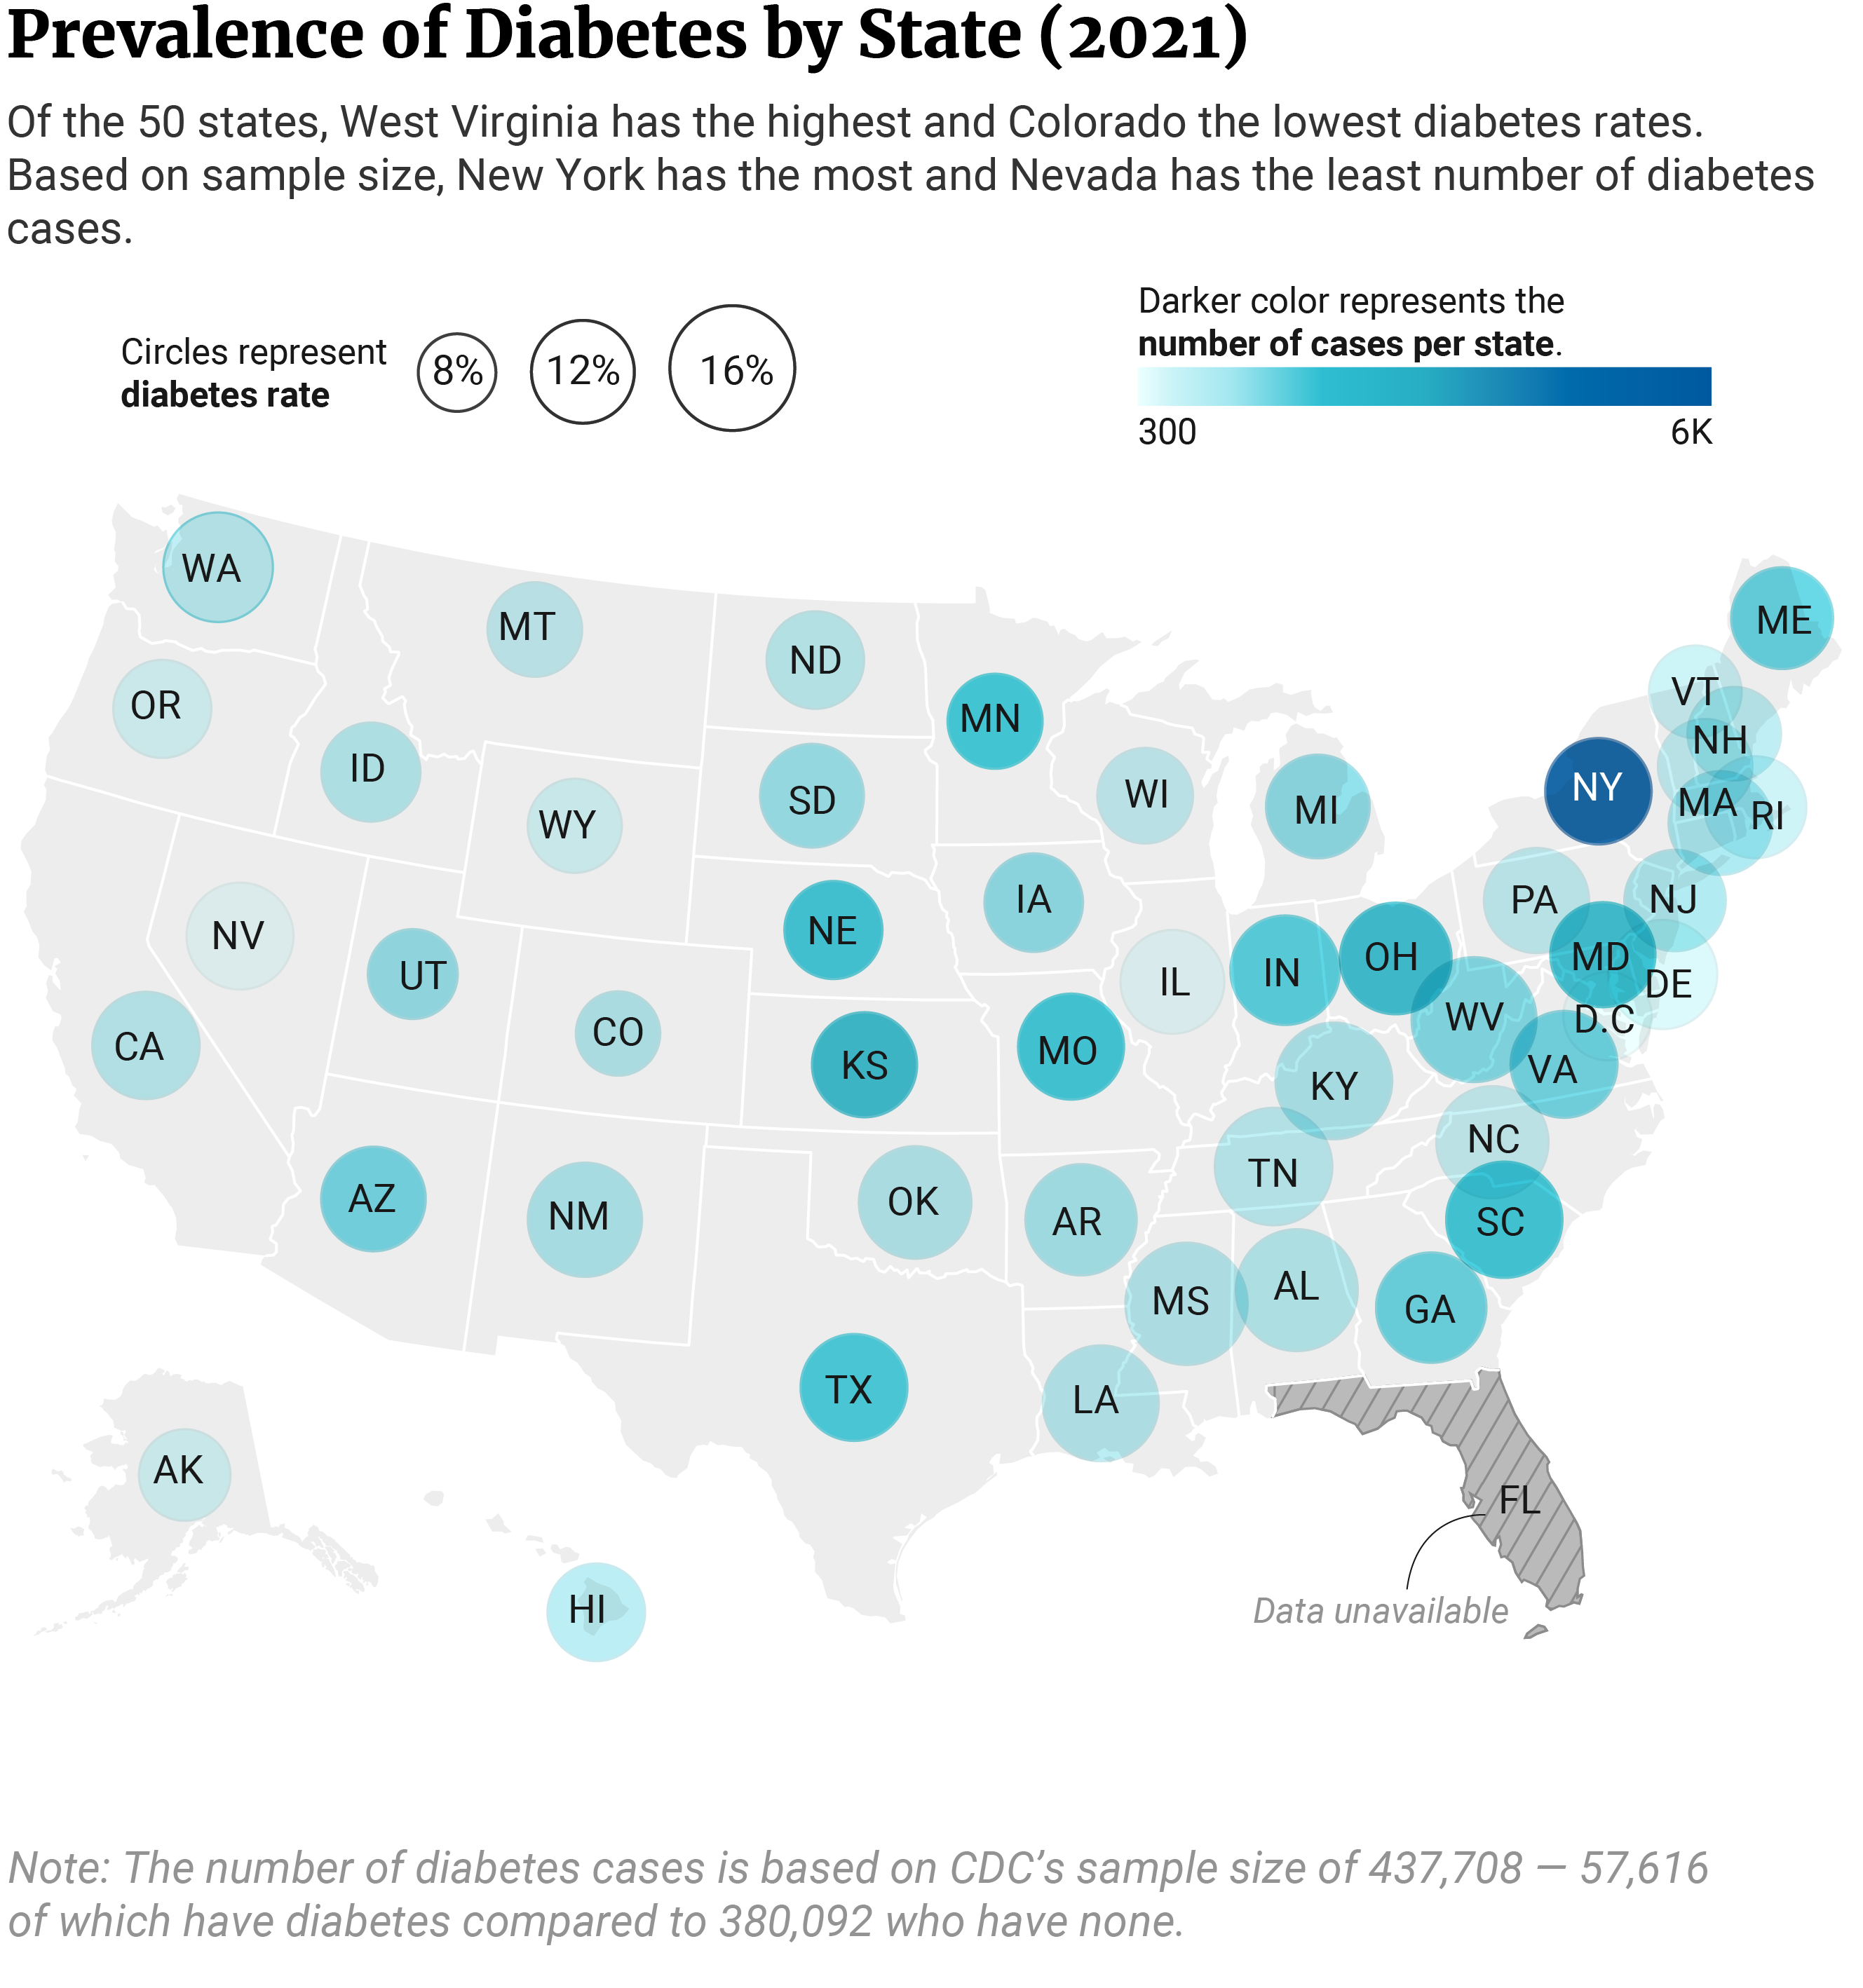
Diabetes Rates by State
West Virginia has the highest diabetes rate at 15.9%. Mississippi and Alabama follow at 15.2% and 15.1%, respectively [3]. Data also came from CDC’s 2021 sample size of 437,708.
Tennessee and Kentucky also got into the top five states with the highest diabetes rates. 14% of Tennessee and 13.8% of Kentucky’s population have diabetes [3].
The state with the lowest diabetes rate is Colorado at 7%. Utah lands second place with 8% and Alaska third place with 8.3% [3].
Vermont is the fourth state with the lowest diabetes rate at 8.5%. Washington and New Hampshire ranked fifth in states with the lowest diabetes rates at 8.7% each [3].
Based on CDC’s sample size of 437,708, New York has the highest number of diabetes cases at 5,437. Kansas follows with 2,344 and Ohio with 2,208 [3].
The states with the lowest number of diabetes cases are Nevada with 345, Illinois with 382, and Delaware with 497 [3].

Diabetes is more prevalent in Southern rural states. Factors that affect the prevalence rate includes:
- Lifestyle choices
- Presence and prevalence of diabetes risk factors like obesity, overweight, poor diet, and inactivity
- Food insecurity and access to healthier foods
- Access to quality healthcare
- Insurance
- Other socioeconomic factors
How Many People Have Diabetes in the World?
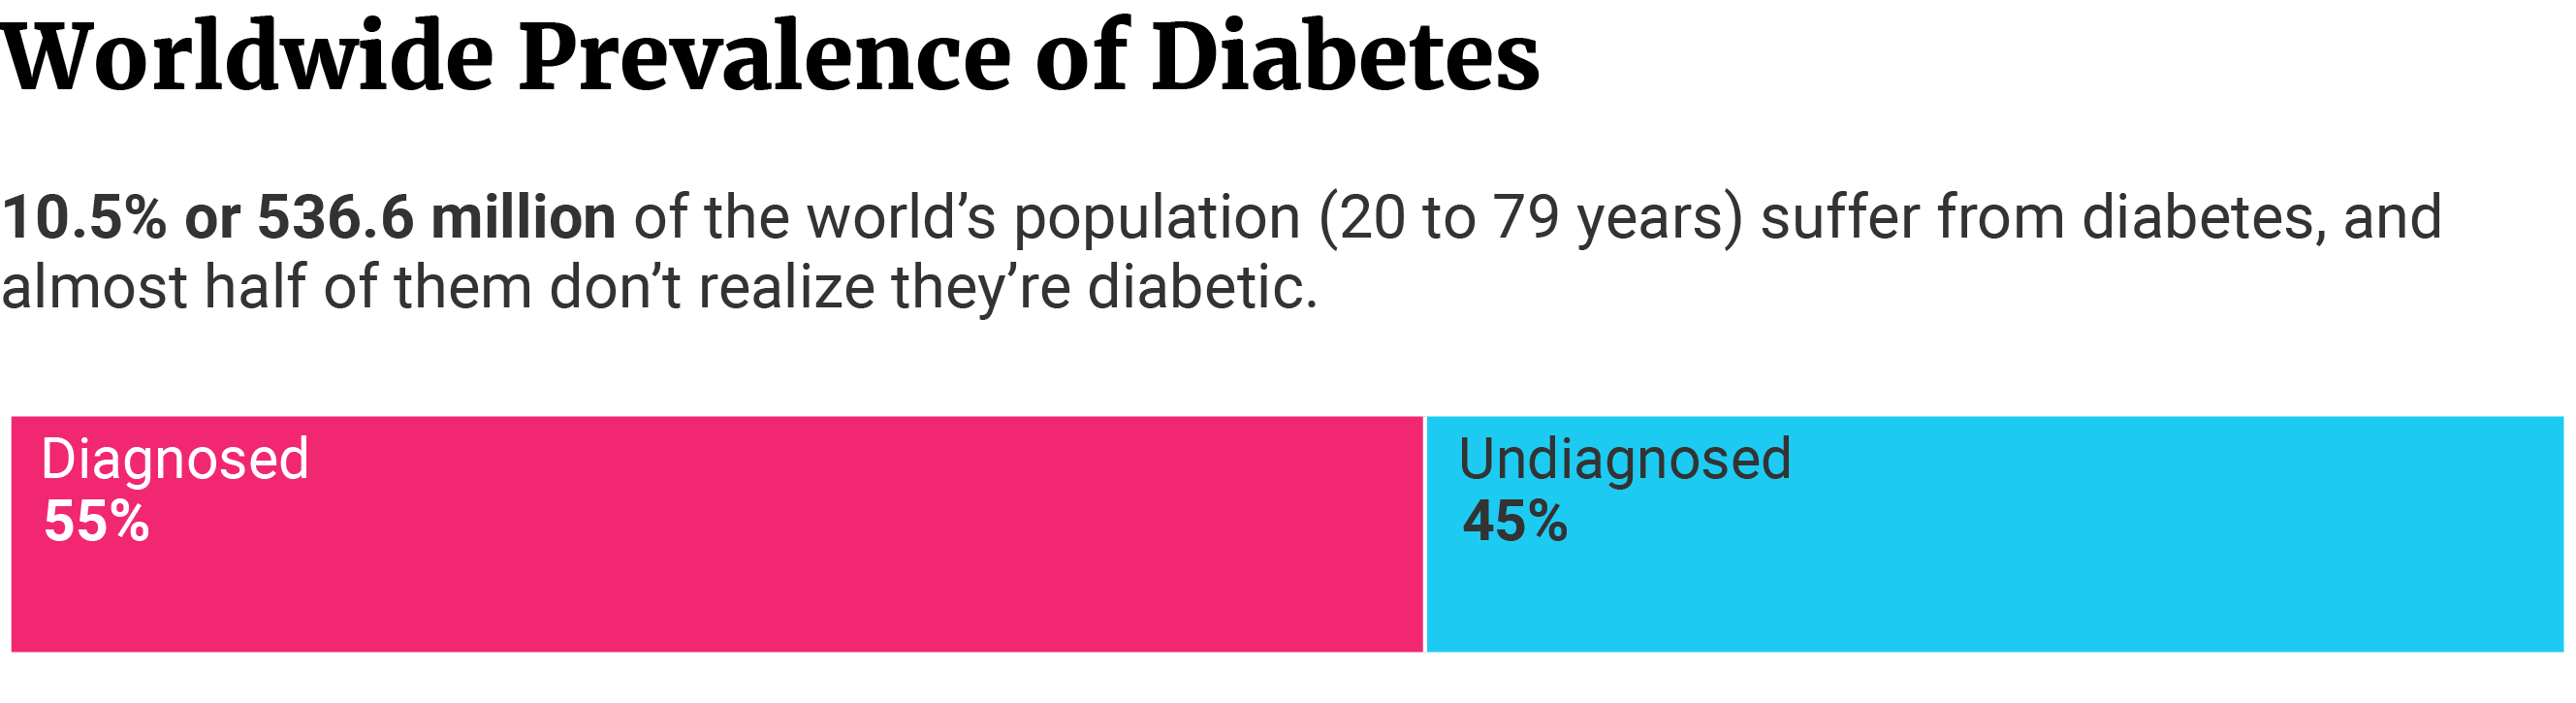
10.5% or 536.6 million adults aged 20 to 79 years have diabetes. This means that more than 1 in 10 of the global population has the disease [20].
44.7% of the total number of global diabetes cases remain undiagnosed. This means that more than 2 in 5 or 239.7 million of them don’t know they have the disease [20].

Type 1 diabetes affects more than 1.2 million of the world’s children and adolescents aged 0 to 19 years. 54% or over 1 in 2 of them are below 15 years old [20].
4 in 5 of those with diagnosed and undiagnosed diabetes live in low-income and middle-income countries [20].
By 2030, the total number of global diabetes cases could increase by 19.7% to 643 million. In a decade and a half, this figure could further increase by 21.8% to 783 million in 2045 [20].
Data came from the 2021 International Diabetes Foundation report.
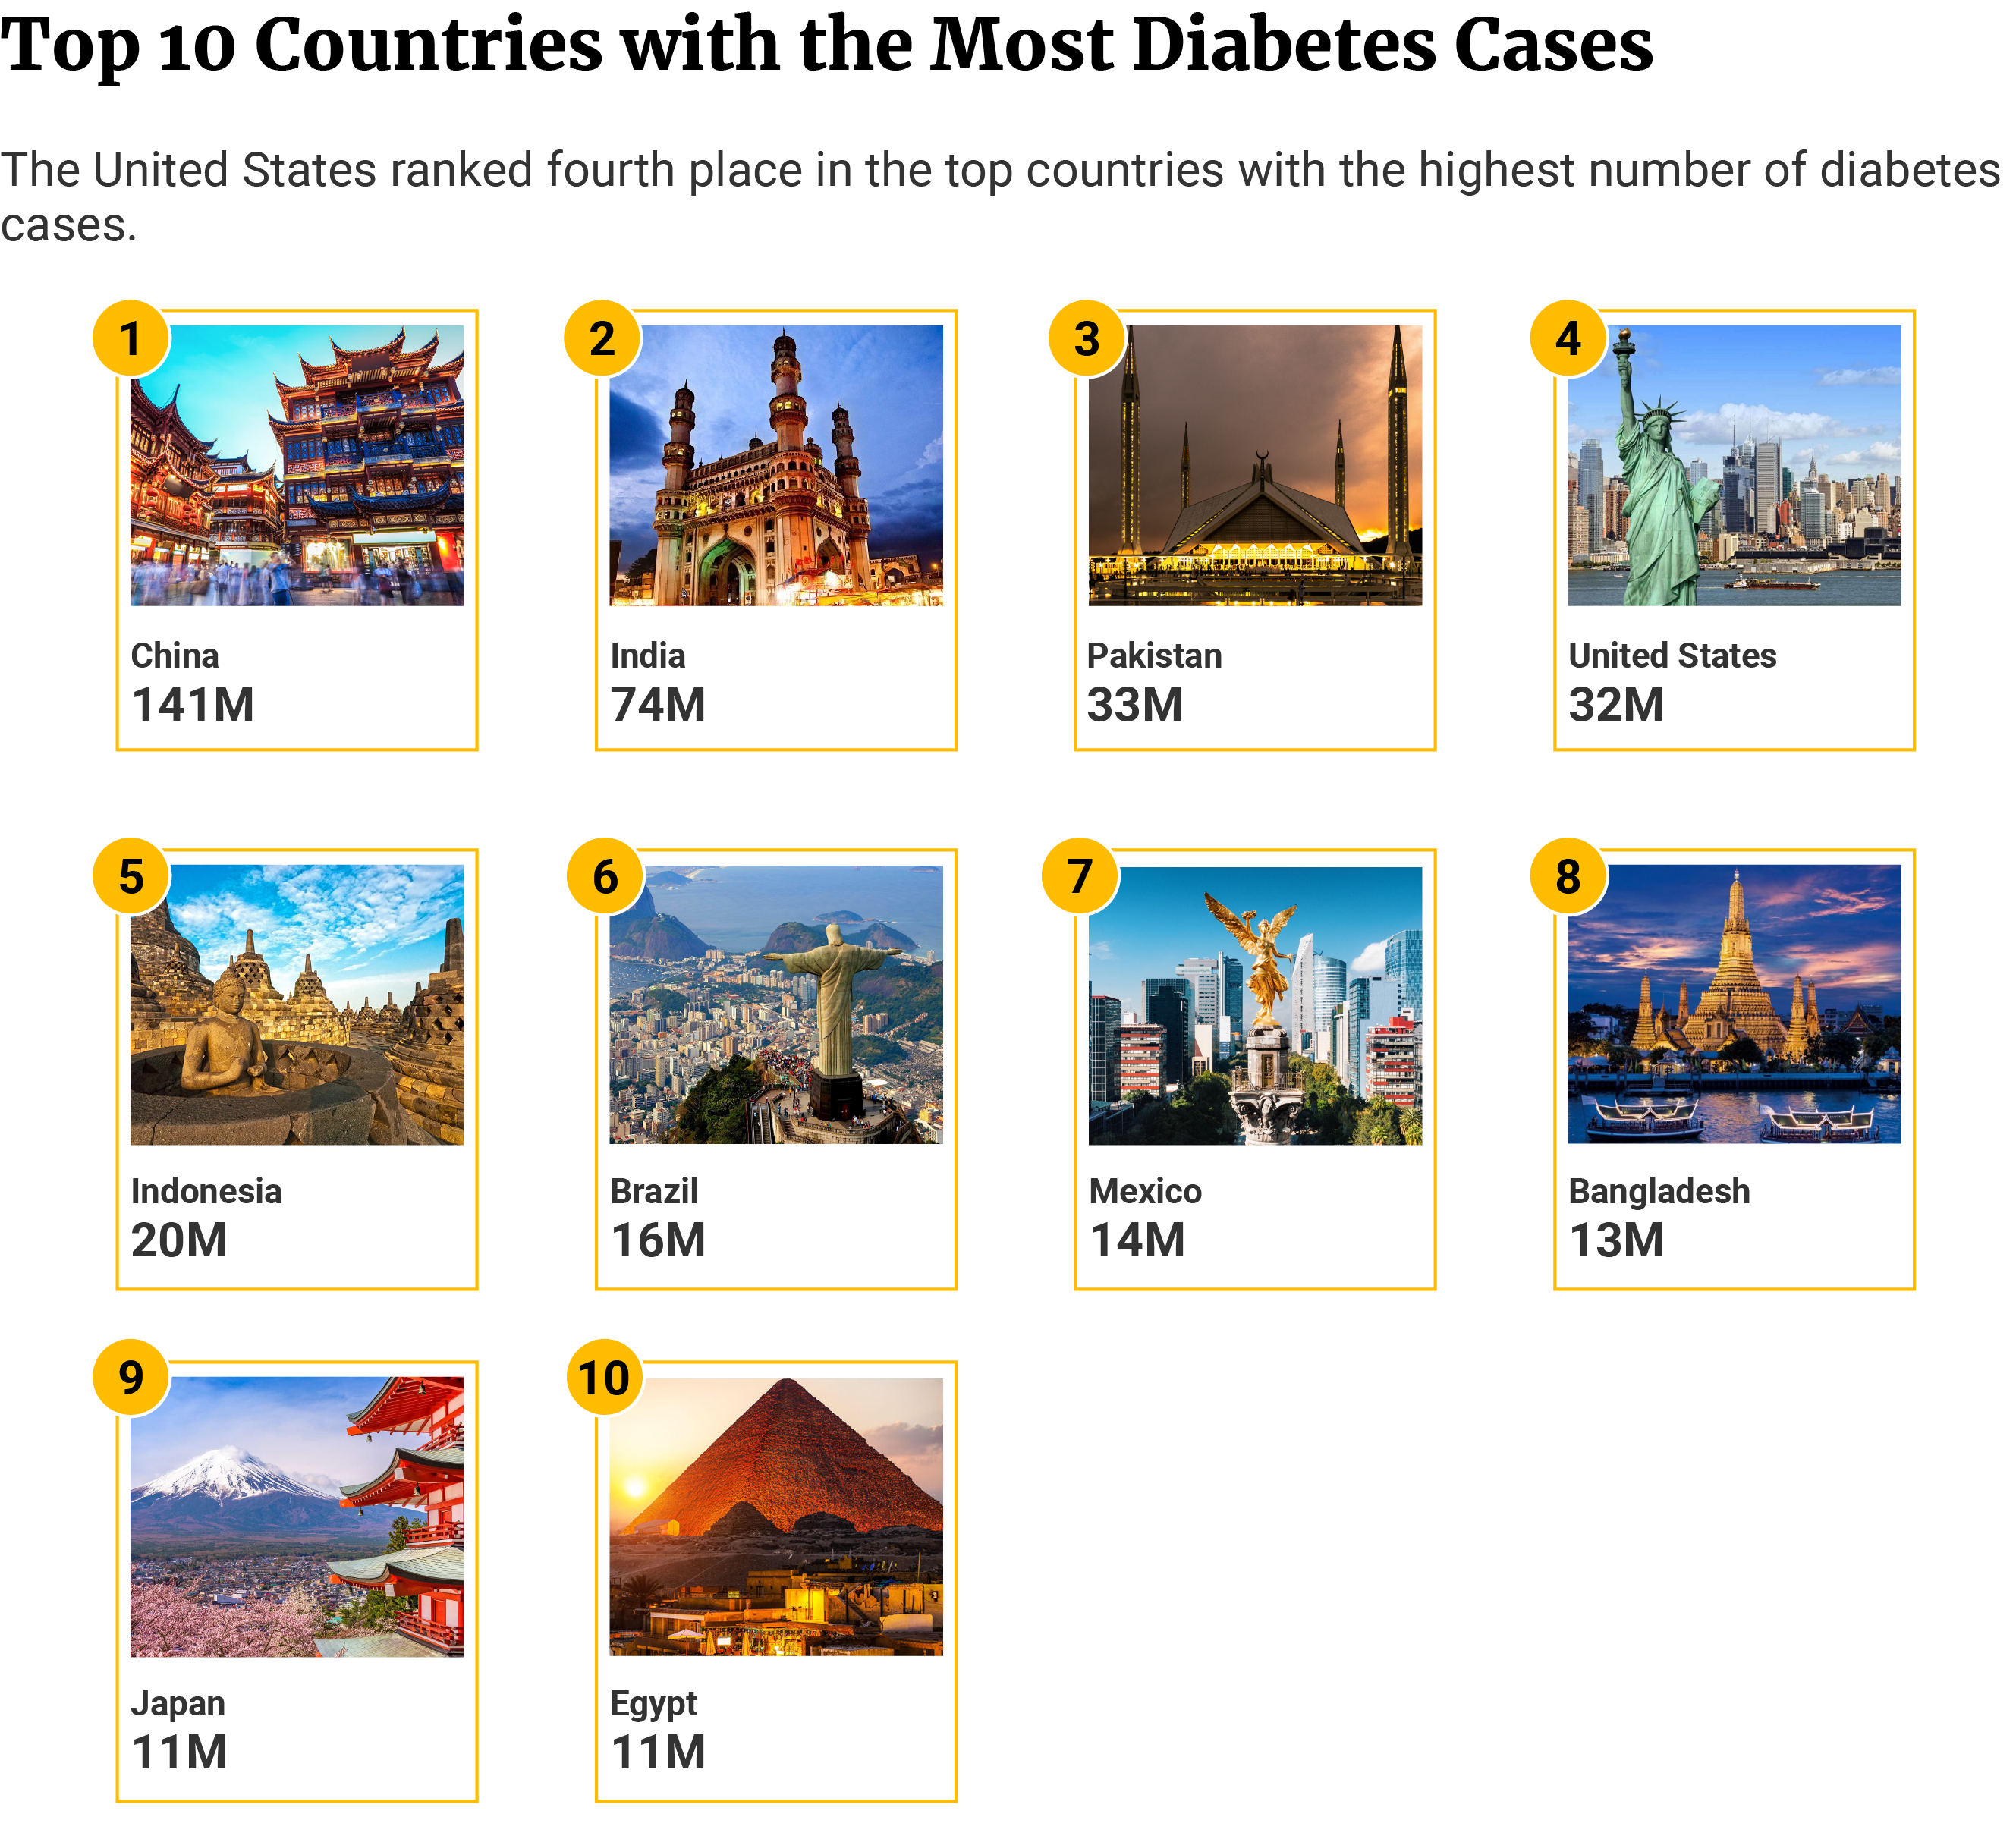
Countries with the Most Diabetes
China has the highest number of diabetes cases with 140.9 million people. They make up more than one-fourth or 26.3% of the total global cases [20].
India follows with 74.2 million or 13.8% of the global diabetes cases. Pakistan comes in third place with 33 million or 6.1% of the total global cases [20].
At 6%, the fourth country with the most diabetes cases is the United States with 32.2 million [20].
Indonesia ranks fifth place with 19.5 million, making up 3.6% of worldwide diabetes cases [20].

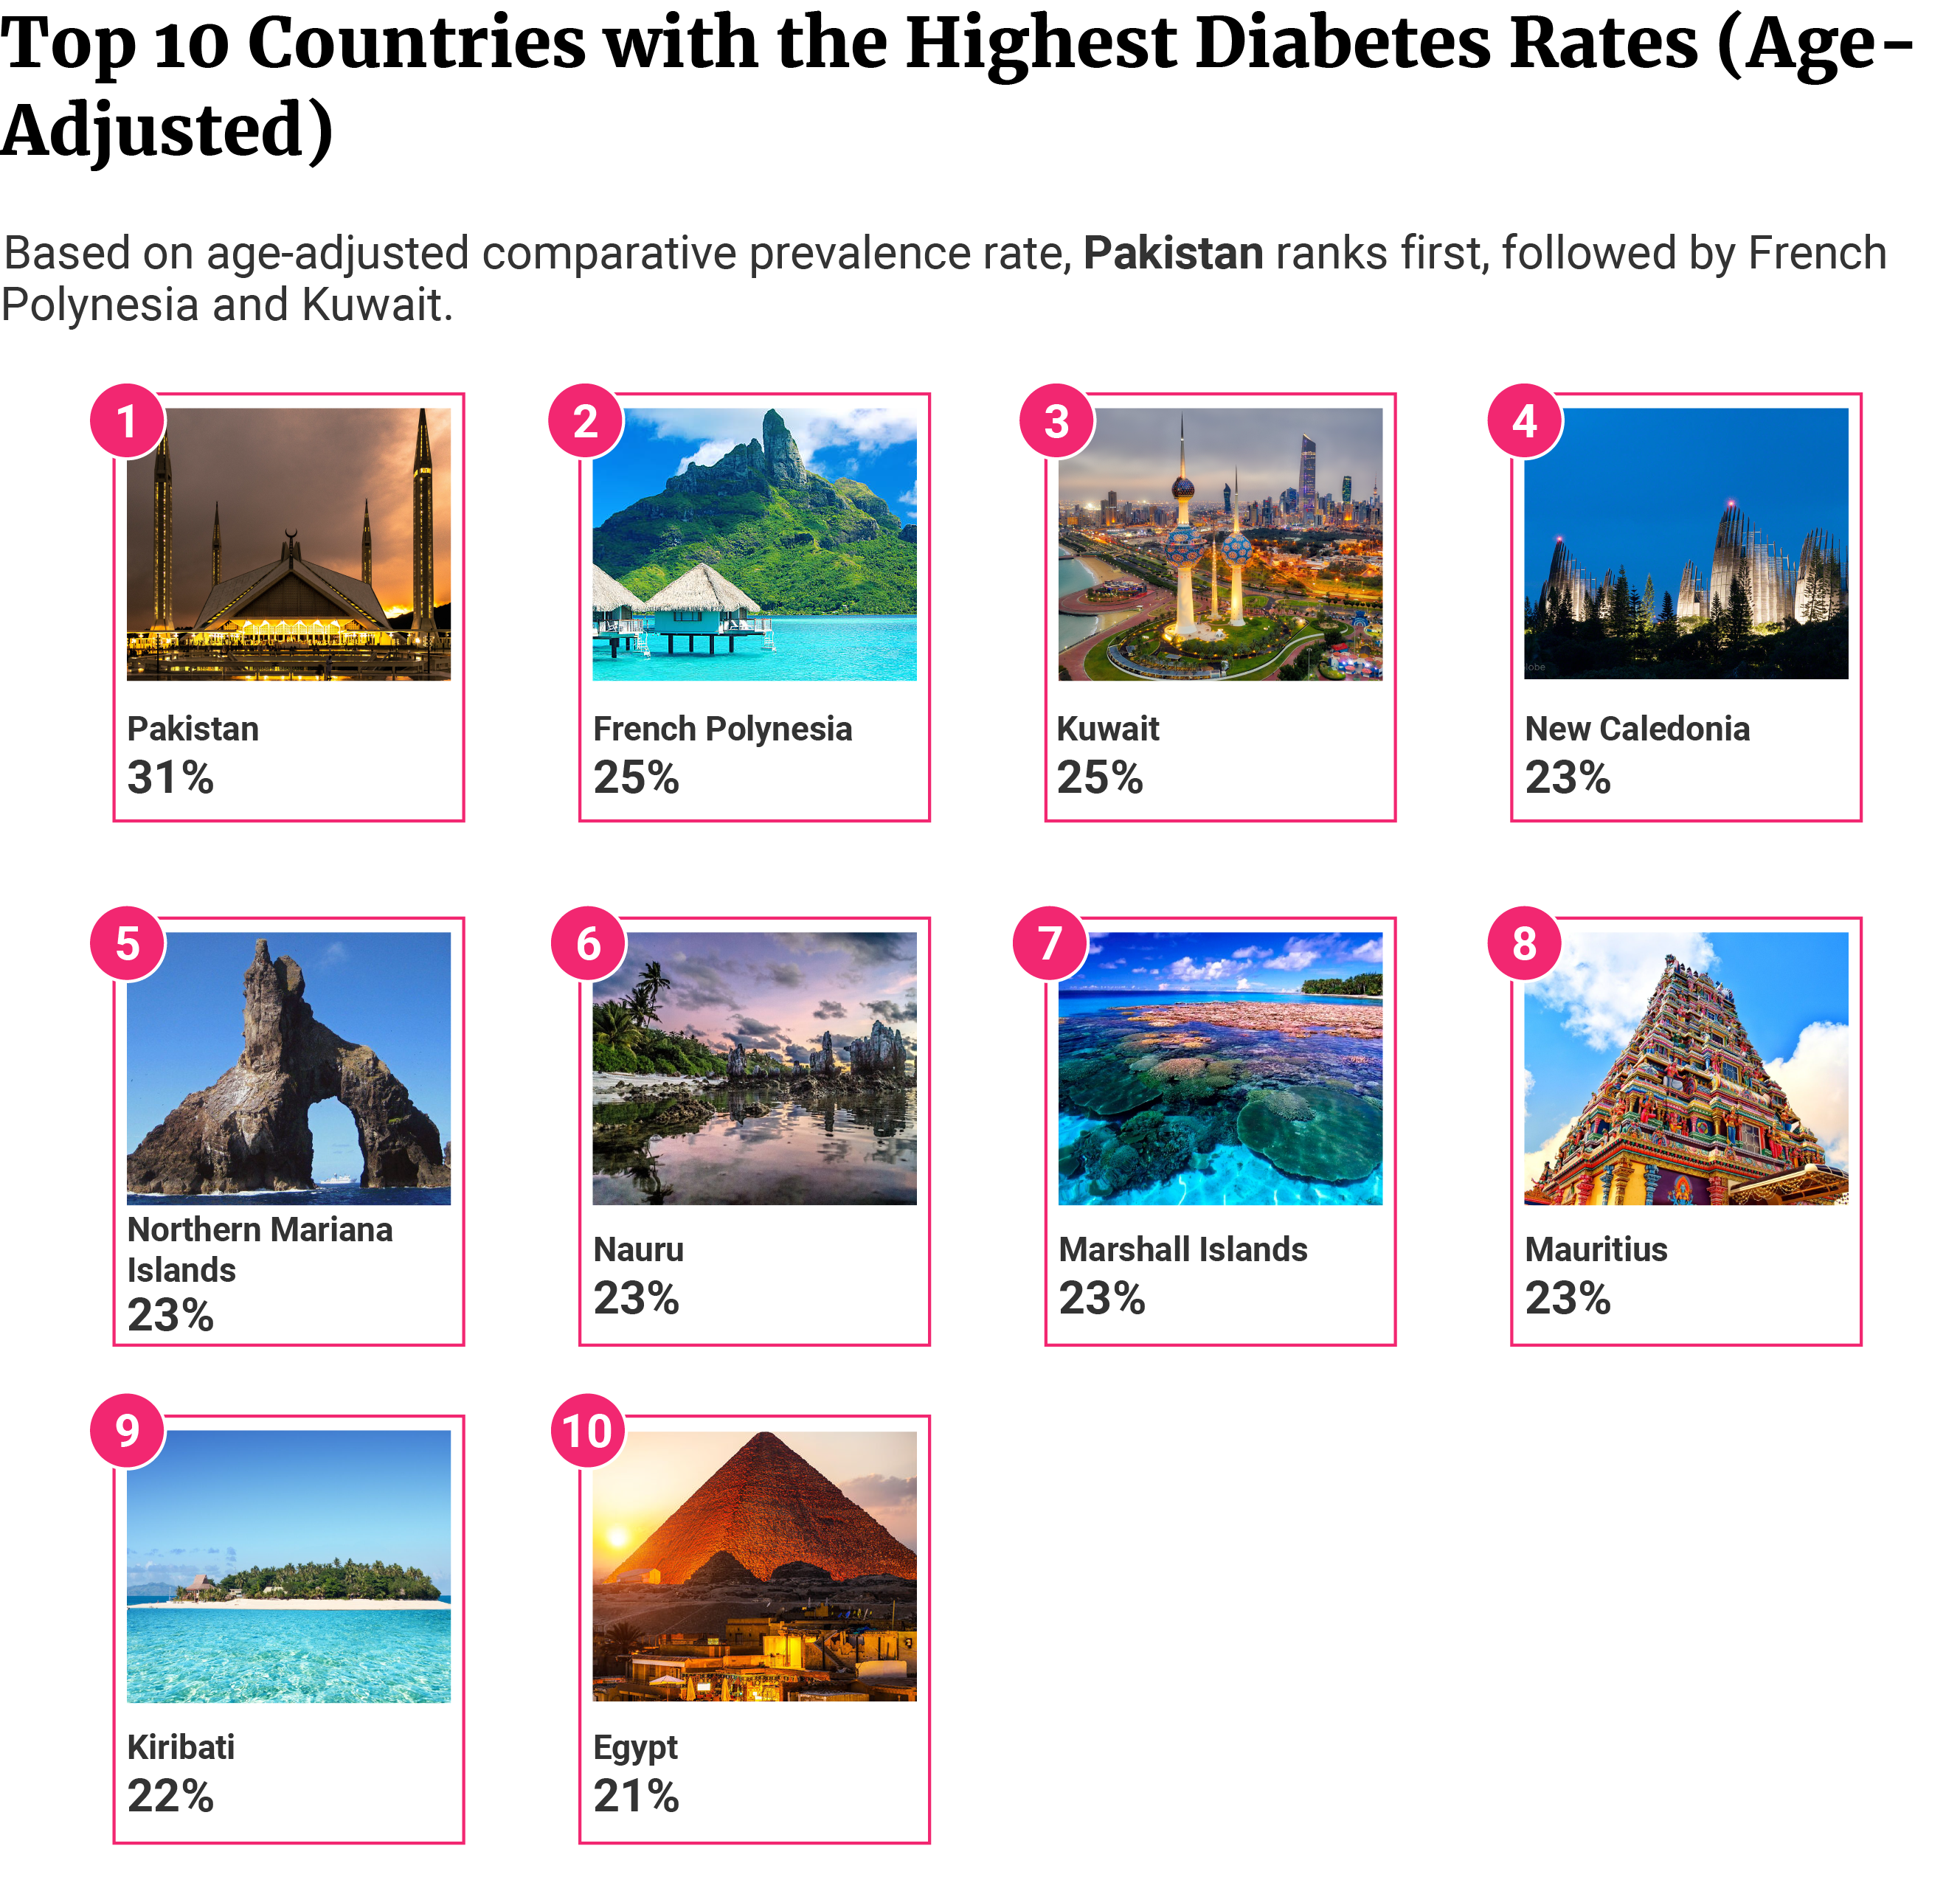
Based on age-adjusted prevalence rate, Pakistan ranks first. 30.8% of its population (20 to 79 years) have diabetes [20].
French Polynesia and Kuwait rank second and third places with 25.2% and 24.9%, respectively [20].
The fourth place goes to New Caledonia, the Northern Mariana Islands, and Nauru at 23.4% each [20].
The Marshall Islands ranks fifth. 23% or nearly one-fourth of its population have diabetes [20].

Diabetes Life Expectancy: Type 1 and Type 2 Life Expectancy
The life expectancy of people with type 2 diabetes at age 50 is 6 years shorter than non-diabetics [29].
Receiving a type 1 diabetes diagnosis at age 10 reduces life expectancy by an average of 19 years [24]. This data came from a 2003 study. It analyzed the 1984 to 2000 National Health Interview Survey data.
However, with lifestyle modification and the right medications, diabetics can achieve longer life.
Can You Live Long with Diabetes?
Staying compliant with the treatment plan can increase life expectancy by 3 years. In some cases, life expectancy can increase by as much as 10 years [29].
This means controlling their weight, cholesterol, blood pressure, and blood sugar.
Untreated and uncontrolled diabetes can lead to serious complications like:
- Kidney disease and kidney failure
- Diabetic retinopathy
- Heart problems and heart attacks
- Stroke
- Gum, mouth, and teeth diseases
- Amputation
Diabetes Amputation Statistics in the US
Amputation caused by diabetes accounted for 75% of non-traumatic lower-extremity amputation cases in 2015. This figure increased by 8.7% from 2000’s 69% [13].

Each year, 65% or 130,000 people out of 200,000 who undergo amputations in the US have diabetes [25].
This means that, every day, around 356 diabetic Americans have an amputation.
Black Americans are 2.3 times more likely to undergo diabetes-related lower limb amputation than White Americans [9].
Black Americans have a 60.9 per 100,000 lower extremity amputation rate than White Americans’ 26.8 per 100,000 [9].
The World Health Organization says that amputations are 10 times more common in diabetics than non-diabetics [19].
Every 30 seconds, one limb gets amputated due to diabetes worldwide [19].
How Does COVID-19 Impact People with Diabetes?
Of the 5,279 COVID-19 patients in New York City, 34.7% of those hospitalized have diabetes. Of those not hospitalized, only 9.7% have diabetes [21].
The same study noted that those who had severe COVID-19 infection had a two to four-fold increase in diabetes risk, compared to those who had non-severe COVID-19 infection [21].
Another study also found that [15]:
- 30% to 40% of hospitalized COVID-19 patients have type 1 or type 2 diabetes.
- 21% to 43% of hospitalized COVID-19 patients with diabetes needed intensive care.
- Compared to non-diabetics, diabetics have a 100% to 250% higher risk of developing severe COVID-19 infection and dying from it.
- Diabetes increased fatality risk in COVID-19 patients with diabetes by 25%.
Excluding diabetes, the other comorbidities in COVID-19 patients are also diabetes risk factors. A study on 1,170 COVID-19 patients noted that [36]:
- 31.5% have hypertension
- 16.2% have diabetes
- 14.6% have dyslipidemia
- 10.4% have obesity
Diabetes Mortality
Diabetes is the eighth leading cause of death in the US in 2020 [5].
It dropped a rank, after having been the seventh leading cause of death in 2019 [5].
How Many People Die from Diabetes Each Year?
73,882 people die from diabetes each year. Data came from the median number of diabetes deaths from 1999 to 2020 [5].
An average of 22.7 per 100,000 people die from diabetes yearly [5].
![]()

Diabetes Deaths Over Time
In 1999, 68,399 people died from diabetes. This increased by 49.4% to 102,188 deaths in 2020. During the same period, the diabetes death rate ranges between 20.8 and 25.6 per 100,000 people [5].
In 2020, 102,188 Americans died from diabetes and its complications, killing 24.8 per 100,000 people [5].
This same year also marks the year the US breached its 100,000th diabetes death [5].
2020 also saw the highest increase in the number of diabetes deaths. From 87,647 deaths in 2019, it increased by 16.6% or 14,541 deaths to 102,188 deaths in 2020 [5].
The COVID-19 pandemic may have contributed to the spike in diabetes deaths.
Diabetes Deaths Demographics
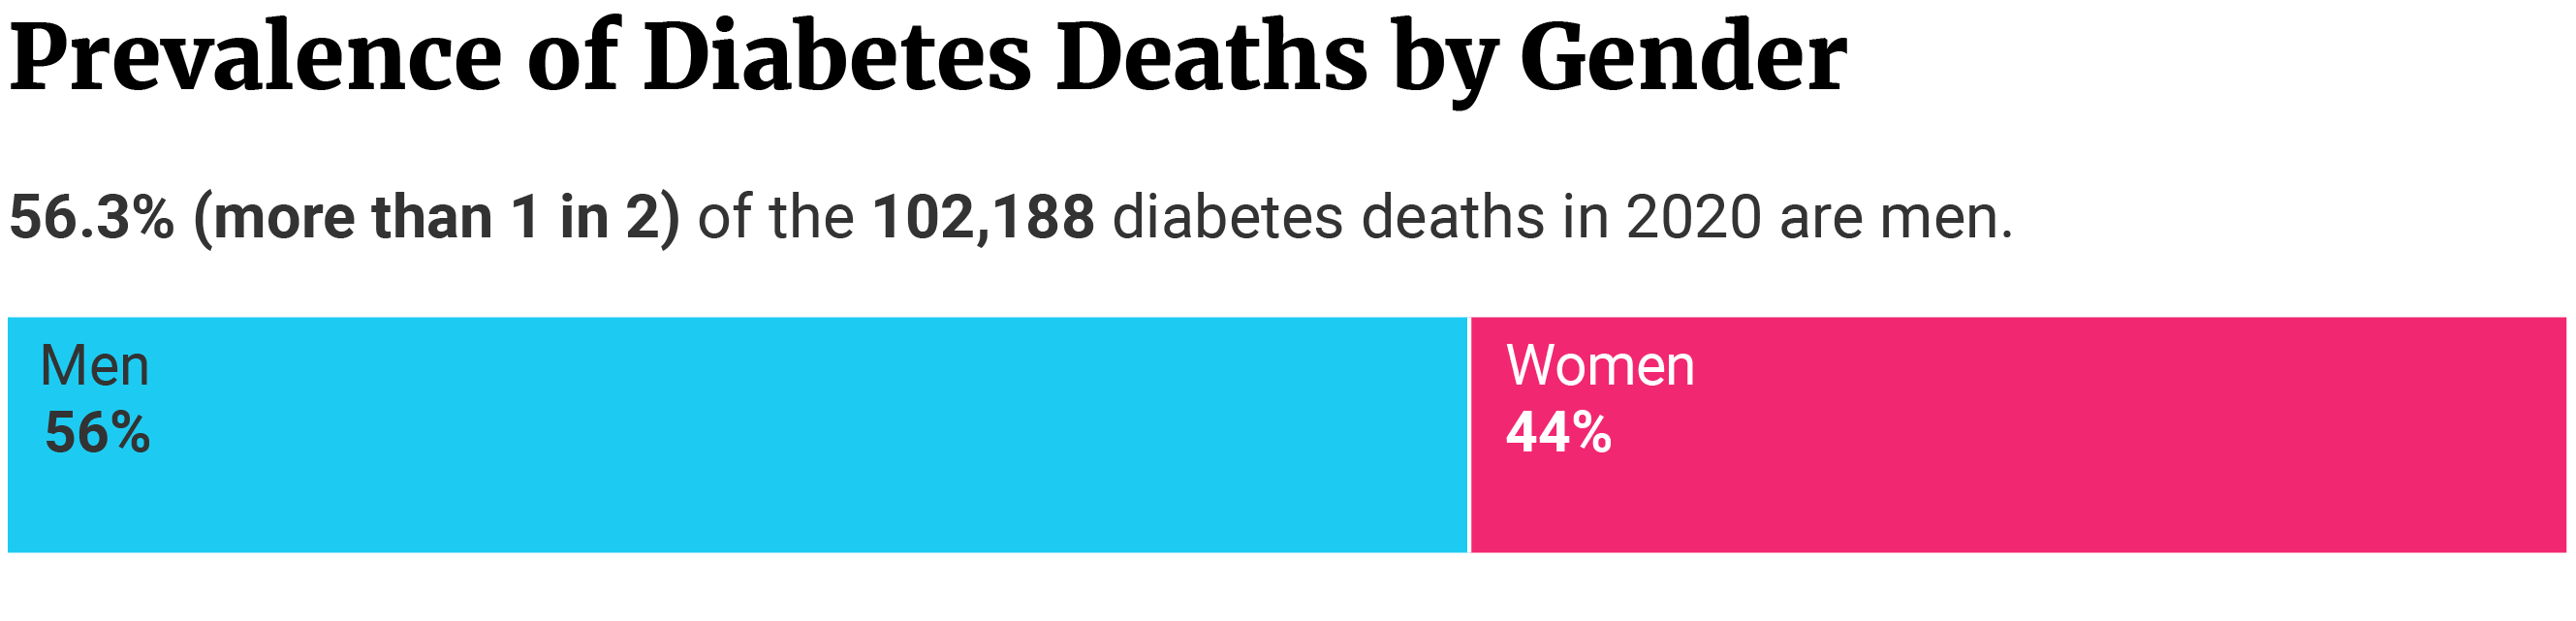
Of the 102,188 diabetes deaths in 2020, men make up 56.3%. Older people aged 60 and above make up 80.91%, and White Americans make up 62.7%.
Diabetes Deaths by Gender Statistics
With 57,532 deaths, men make up 56.3% of the 102,188 diabetes deaths in 2020. The crude death rate among the male population is 35.5 per 100,000 people [5].
Women make up 43.7% of the total diabetes deaths in 2020 with 44,656. Among the female population, the crude death rate is 26.7 per 100,000 people [5].

Diabetes Deaths by Age Statistics
With 82,677 deaths, older people (60 and above) make up 80.91% of the 102,188 diabetes deaths in 2020 [5].
Of the older age group, those aged between 70 and 74 years had the highest number of diabetes deaths. Their age group makes up 14.2% or 14,533 of the 102,188 diabetes deaths [5].
When it comes to the crude death rate, diabetes affects those between 80 and 84 years the most. 189.3 per 100,000 people in their age group succumbed to diabetes in 2020 [5].
With 16,801 deaths, middle-aged adults (40 to 59 years) make up 16.44% of the 102,188 diabetes deaths in 2020 [5].
Of their age group, those between 55 and 59 years had the highest number of diabetes deaths. They make up 7.4% or 7,519 of the total diabetes deaths [5].
Younger adults between 20 and 39 years make up 2.50% of the total diabetes deaths with 2,555 deaths. Of their age group, diabetes death is highest among those between 35 and 39 years with 1,168 deaths [5].
Children and adolescents make up 0.15% of the total diabetes deaths with 154 deaths. Diabetes death is highest among those between 15 and 19 years with 93 deaths [5].
Diabetes Deaths by Race Statistics
With 64,098 deaths, White Americans make up 62.7% of the 102,188 diabetes deaths in 2022 [5].
Black Americans follow with 19,495 deaths. They make up 19.1% of the total diabetes deaths [5].
The third most affected ethnicity is Hispanics. With 12,832 deaths, they make up 12.6% of the total diabetes deaths [5].
Based on the crude death rate, American Indians and Alaska Natives had the highest death rate. 49 per 100,000 people died from diabetes and its complications [5].
Black Americans had the second-highest death rate. 44.7 per 100,00 Black Americans succumbed to diabetes and its complications [5].
White Americans rank third in crude death rate with 32 per 100,000 [5].
Black Americans are 2.1 times more likely to die from diabetes than White Americans [9].
Diabetes Mortality by State
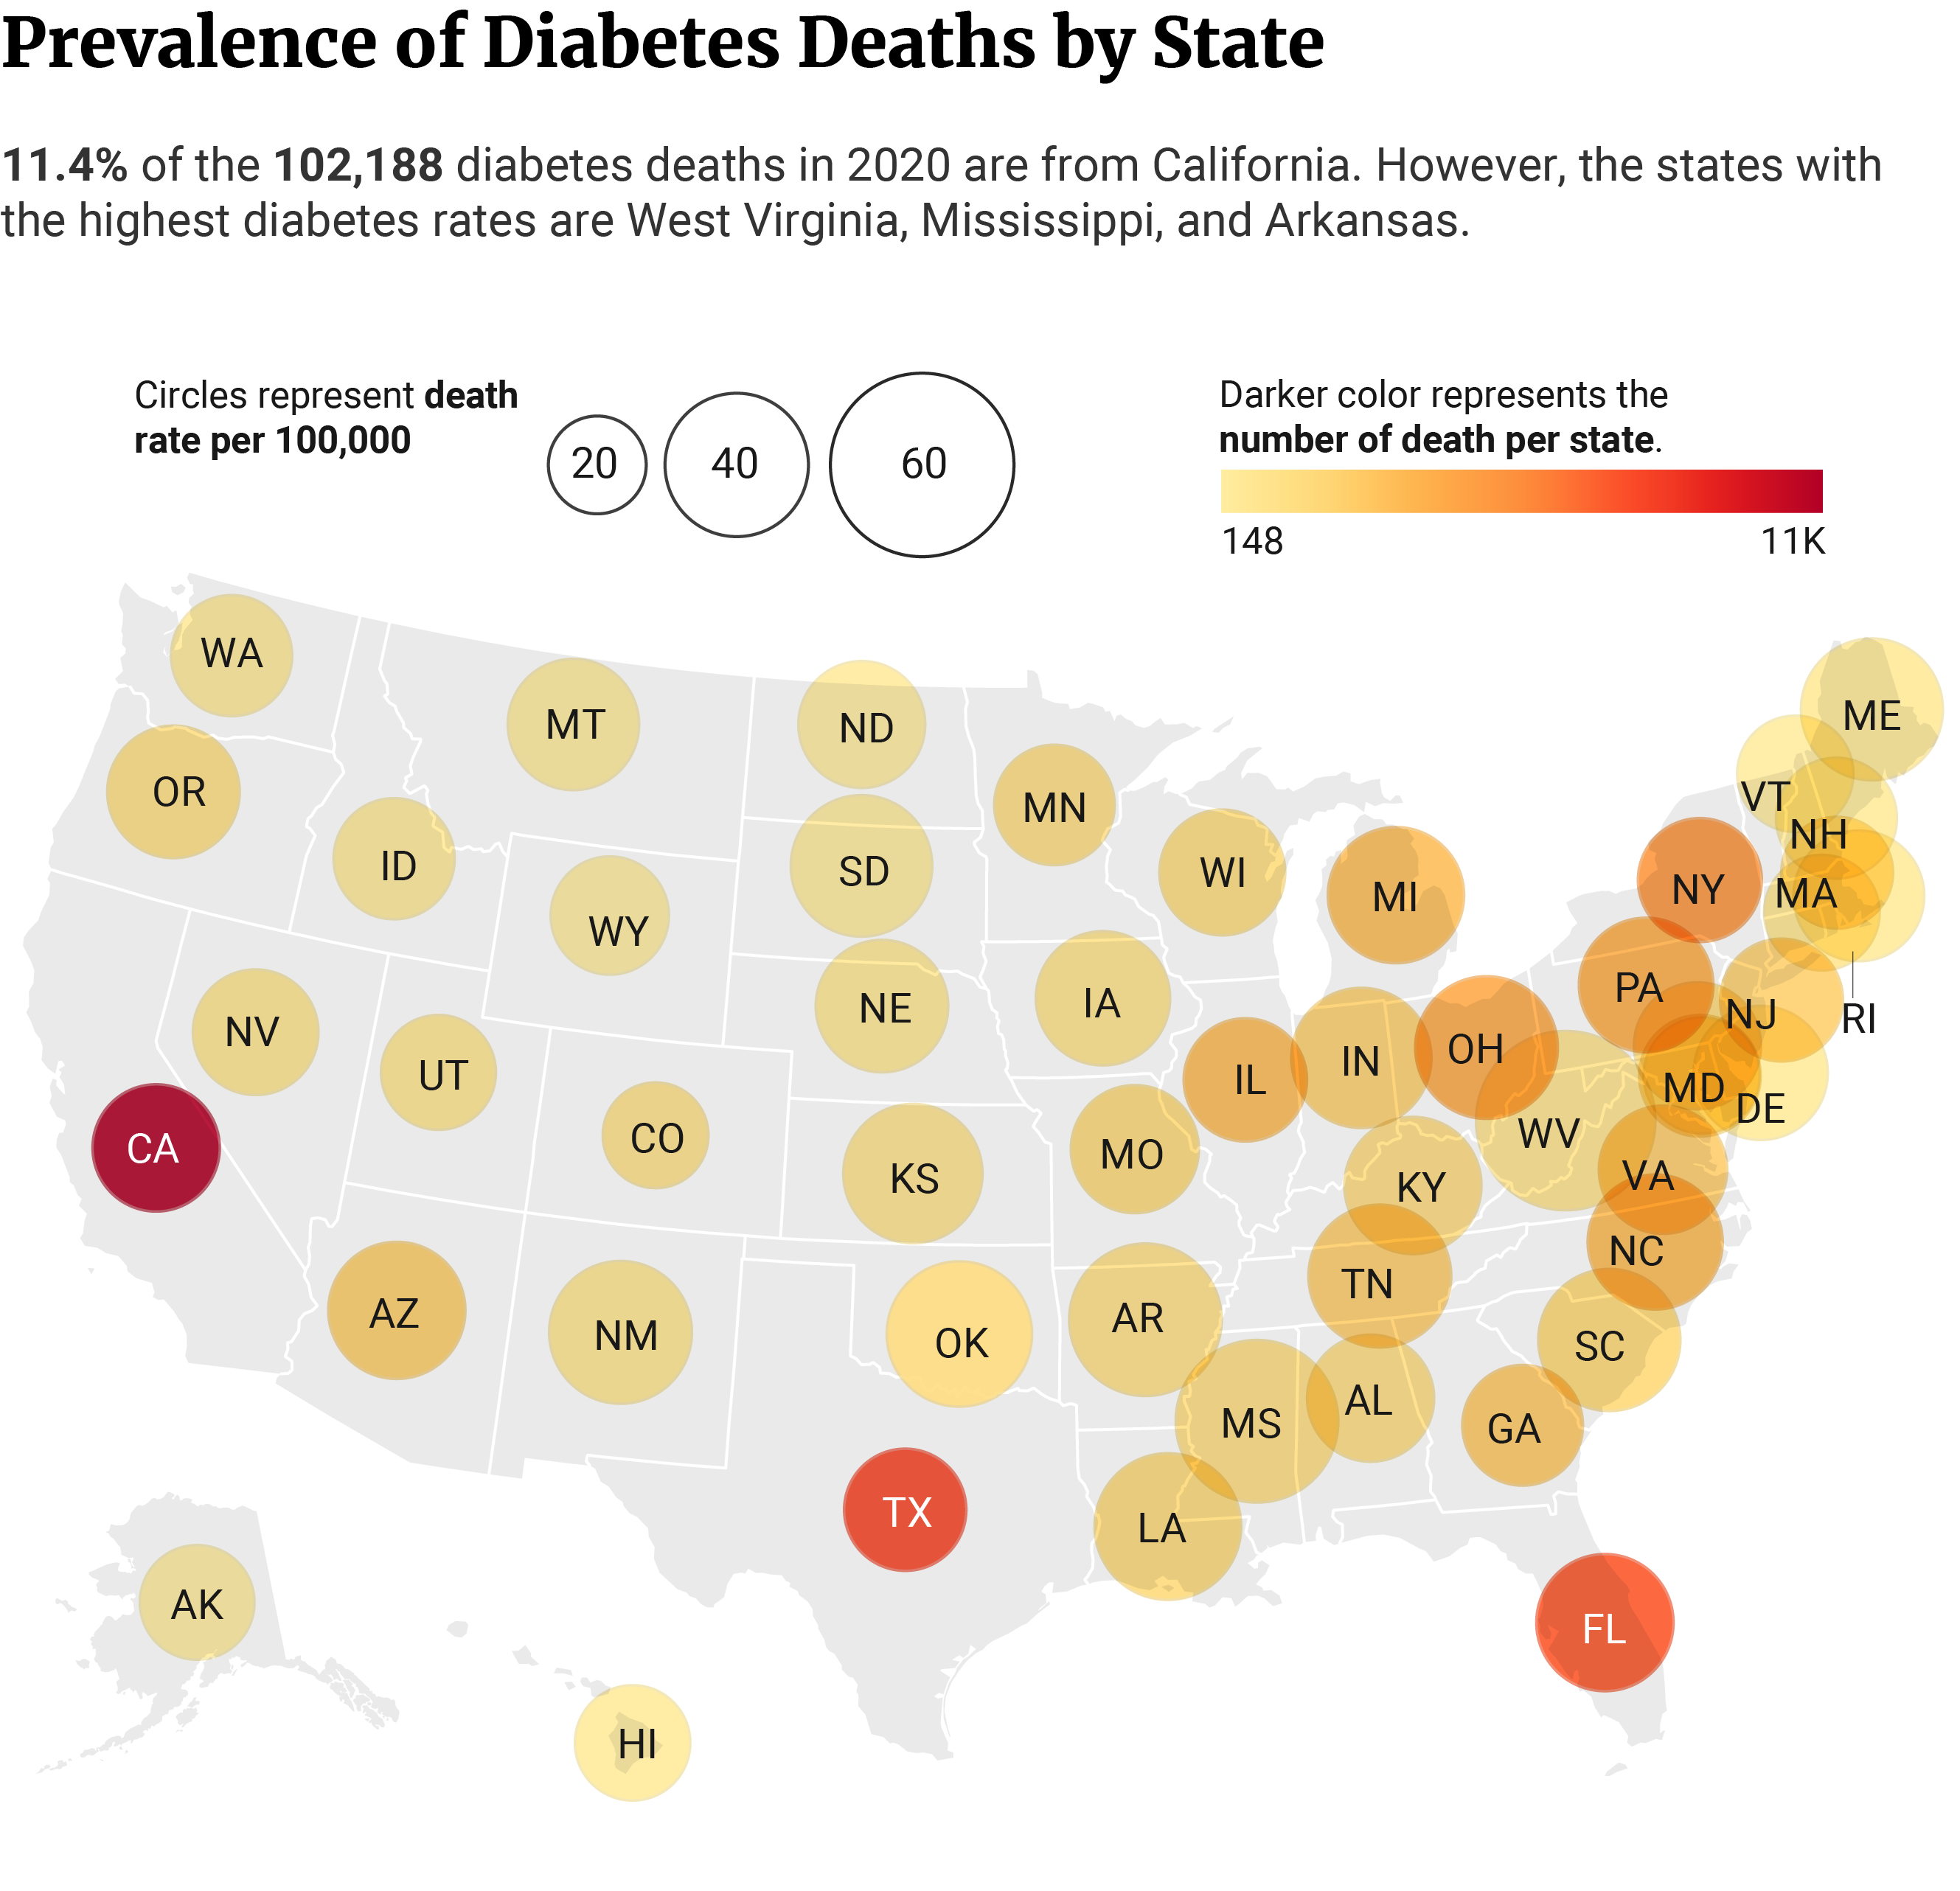
Based on the crude death rate, West Virginia had the highest with 60.2 per 100,000. Mississippi and Arkansas rank second and third places with 49.2 and 43.1 per 100,000, respectively [5].
The states with the lowest crude death rates are [5]:
- Colorado with 20.1 per 100,000
- Massachusetts with 22.6 per 100,000
- Alaska with 23.8 per 100,000
Owing to its large population, California makes up 11.4% of the 102,188 diabetes deaths in 2022 with 11,642 deaths [5].
Texas ranks second with 7,990 deaths or 7.8% of the total diabetes deaths. Florida ranks third. It makes up 7.4% of the total deaths, with 7,528 deaths [5].
The states with the lowest number of diabetes deaths are [5]:
- Wyoming with 148 deaths
- Vermont with 153 deaths
- Alaska with 174 deaths

Cost of Diabetes Per Year
Diabetes cost the US $327 billion in 2017 [2].
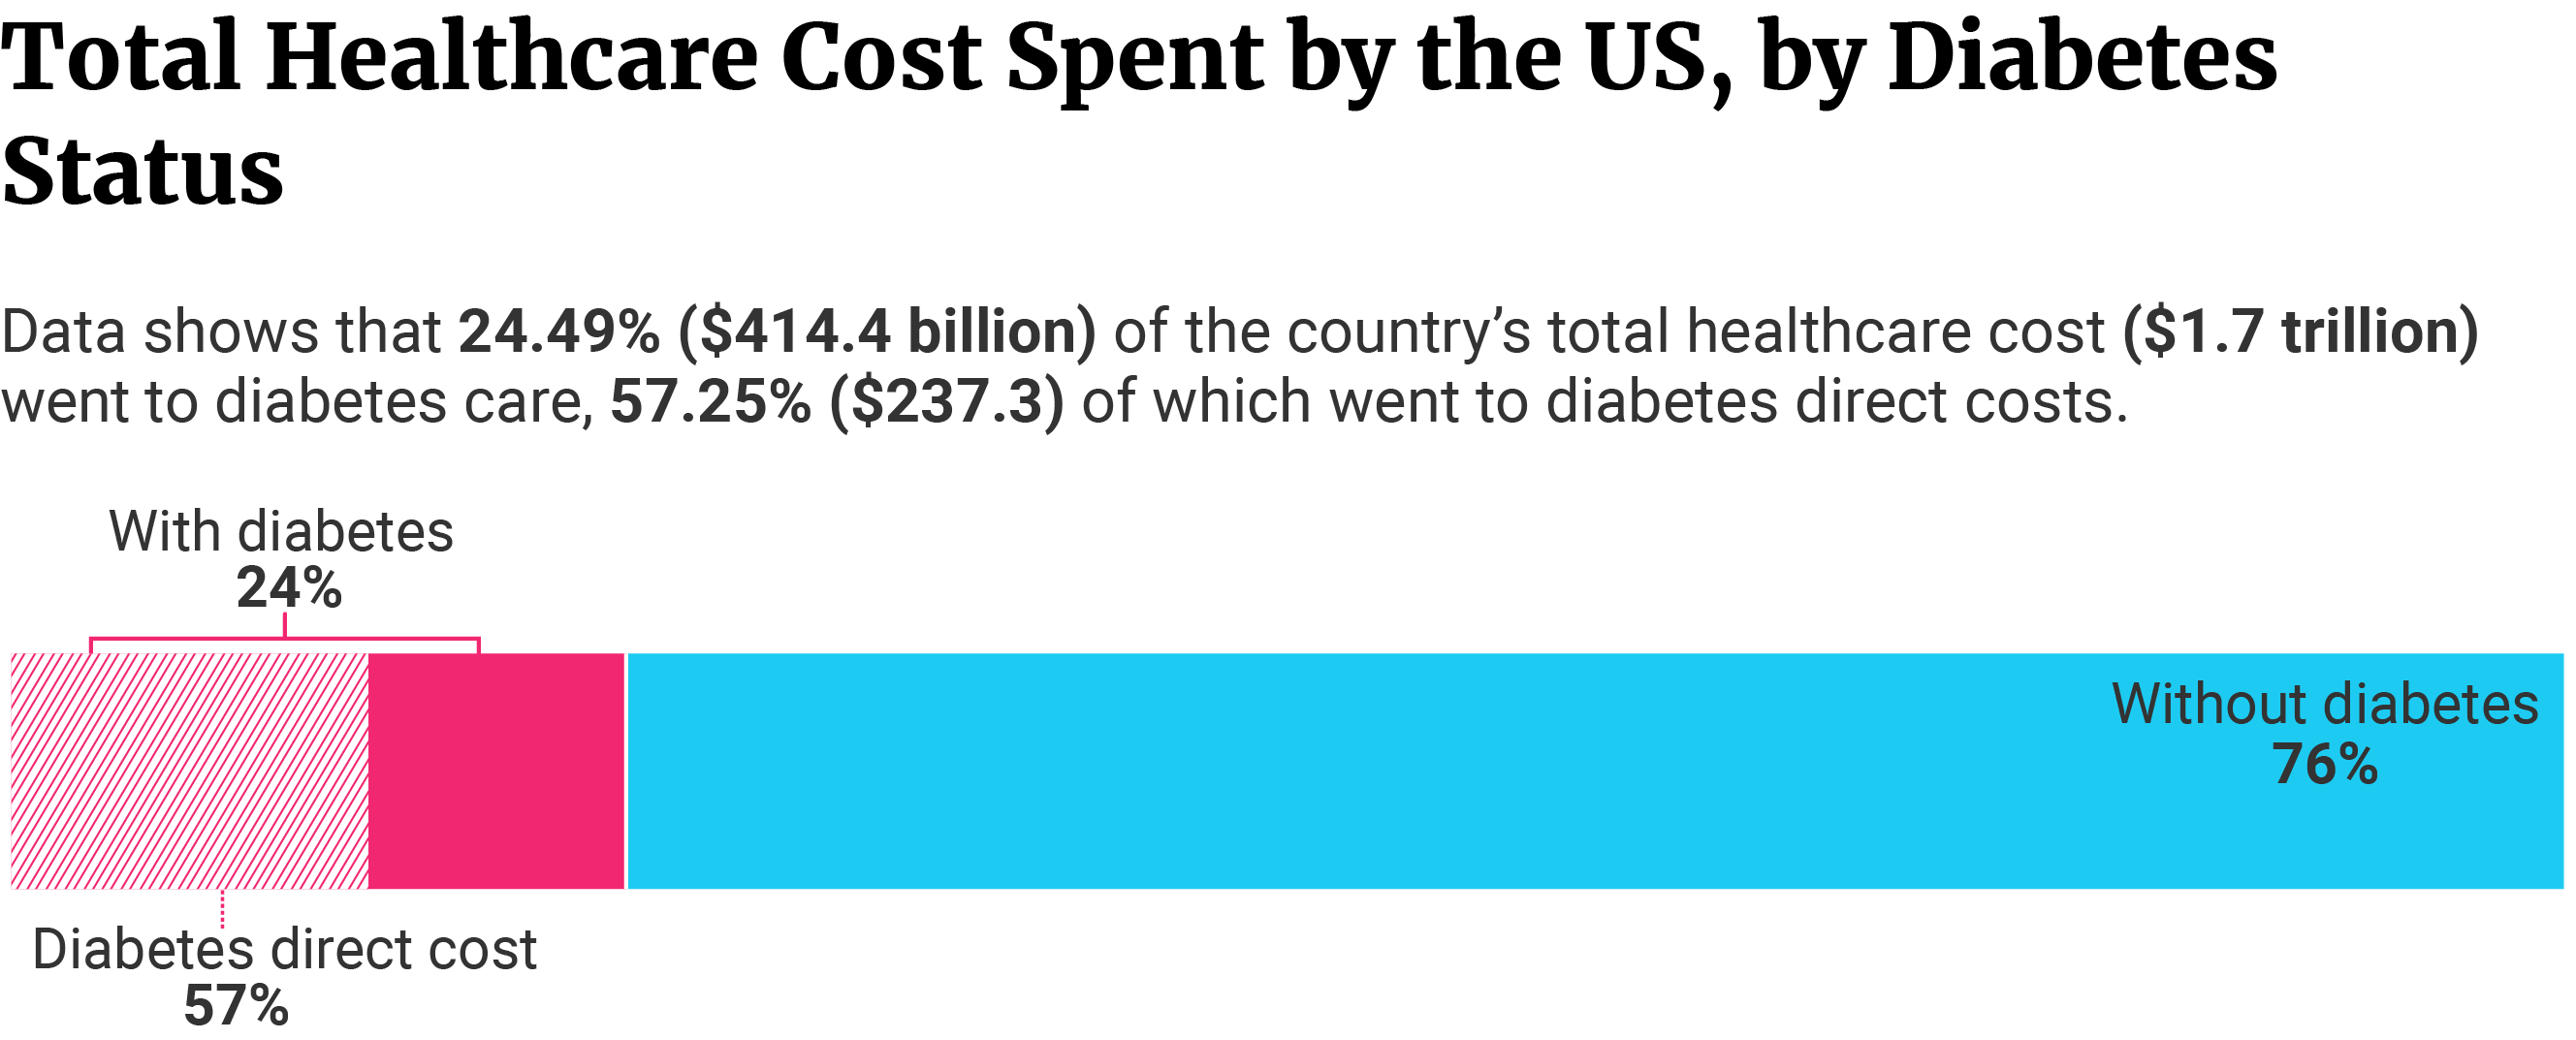
The total healthcare expenditure by diabetes status (with diabetes vs without diabetes) in 2017 amounted to about $1.7 trillion [2].
- People with diabetes incurred 24.49% or a total of $414.4 billion of the total healthcare expenditure. This shows that, for every $4 in healthcare dollars, $1 went to caring for a diabetic person.
- Of the $414.4 billion, 57.25% or $237.3 billion went to diabetic medical costs. For every $7 healthcare dollars, $1 went to diabetes direct cost.

The annual economic toll of diabetes increased by nearly 60% in just a decade [2].
In 2007, diabetes cost the US $174 billion. Adjusting it for general inflation and using 2017-year dollars, it amounted to $205 billion [1]. Comparing it to 2017’s annual cost of $327 billion, it shows a 59.5% expenditure growth [2].
Economic Cost of Diabetes Per Year
In 2017, the US spent $327 billion on diabetes [2].
72.48% went to direct medical costs at $237 billion, and 27.52% went to indirect costs at $90 billion [2].
Of the $90 billion indirect cost, 41.7% went to inability to work caused by diabetes-related disabilities. It cost the US $37.5 billion [2].
29.9% ($26.9 billion) went to decreased productivity of employed people with diabetes [2].
The third highest indirect cost is productivity loss caused by premature death. This made up 22.1% of the indirect costs at $19.9 billion [2].
Absenteeism due to diabetes cost the US $3.3 billion. This accounts for 3.7% of the total indirect cost [2].
2.6% of the cost went to decreased productivity of unemployed individuals at $2.3 billion [2].
Diabetes Treatment Cost
Direct diabetes treatment cost the US $237 billion in 2017. 61.5% ($145,841) of it went to caring for older people aged 65 or older [2].
Of the $237 billion, institutional care cost the most with $76.2 million. It made up 32.1% of the total direct medical cost of diabetes. Of the 76.2 million, $69.7 million went to hospital inpatient care. It made up 29.4% or nearly one-third of the total direct costs [2].
Prescription anti-diabetic medication cost is the second highest expenditure. At $71.2 million, it’s 30% or nearly one-third of the total direct cost as well [2].
Other anti-diabetic agents (including insulin) and supplies ranked third in total expenditure. Amounting to $35.9 million, they made up 15.1% of the total direct costs. Insulin itself made up 6.3% ($15 million) of the total direct cost [2].
Physician visits ranked fourth in total expenditure with $30 million. It accounts for 12.6% of the total direct cost [2].
Combined emergency department and hospital outpatient visits ranked fifth in total expenditure. They made up 8.5% of the total direct cost with $20 million [2].
Individual Diabetes Cost Per Year
Diabetics spend an average of $16,752 per year on healthcare costs, compared to non-diabetics’ $7,151 [2].
Of the $16,752, 57.3% of it or $9,601 went to diabetes direct cost [2].
Data shows that diabetics spend 2.3 times more on healthcare expenses than non-diabetics [2].
Cost of Diabetic Supplies and Medications
With insurance, a diabetic patient using insulin spends $4,822 in extra costs for diabetes control. This is nearly 10% of the annual income of an average American [26].
The extra expenses include anti-diabetic medications and supplies.
Over-the-counter medical supplies cost the most at $3,922, making up 81.3% of the total cost [26].
10.6% of the total cost went to medications, amounting to $512 [26].
A diabetic patient using insulin with no insurance, on the other hand, shells out an additional $1,300 [26]. It’s 27% more at $6,122.
Common Diabetes Medications
49.1% of diabetic patients take non-sulfonylureas drugs, which include metformin [33]. It reduces the amount of glucose produced by the liver.
35.7% take sulfonylureas like glipizide and glyburide [33]. These drugs prompt the pancreas to produce more insulin to lower blood sugar levels.
19.4% use thiazolidinediones for diabetes control [33]. These include drugs like pioglitazone and rosiglitazone. They increase the cell’s sensitivity to insulin.
72.9% of people with diabetes (age 20 and older) use oral anti-diabetics with or without insulin [33].
15.3% use insulin alone, while 11.8% don’t use any anti-diabetic drugs [33].
Insulin Costs: How Much is a Year of Insulin?
8.3 million diabetic Americans use insulin, and each person shells out about $6,000 yearly for insulin [18].
From 1991 to 2016, the growth in the cost of insulin per milliliter skyrocketed. From an average of 2.9% annual increase between 1991 and 2001, it ballooned to a 20.7% annual increase between 2012 and 2016 [18].
Factors that contributed to the increase in insulin cost per milliliter included:
- Emergence of newer, more expensive insulin products
- Price hikes of older insulin products
- Regulations and patents that limited competition
However, between 2016 and 2018, the growth rate dropped to about 1.5% annually [18].
If the skyrocketing trend continues, insulin could cost each person $12,446 by 2024 [18].
If it follows the slower growth rate of 2016 to 2018, the cost could increase to only about $6,263 by 2024 [18].
Some of the regulations and patents that limit competition will expire soon. These could also help lower the cost of insulin in the coming years.
Marijuana and CBD for Diabetes
A study using animal models showed CBD reduced diabetes risk in non-obese diabetic mice — from 86% in non-treated mice to 30% after CBD treatment [38].
Another study also showed that CBD delayed the onset of diabetes in non-diabetic obese mice [39].
- Of those who received CBD, only 32% received a diagnosis of diabetes.
- 86% of those who received emulsifiers received diabetes diagnosis.
- Of the untreated mice, 100% of them developed diabetes.
However, these studies were done on animal models. We don’t have enough CBD studies done on humans with diabetes.
Related: CBD Oil for Diabetes
There’s one notable study though on the effects of marijuana use on human glucose and insulin levels [28].
- Current marijuana users have a 16% lower fasting insulin level than non-marijuana users.
- They also have a 17% lower HOMA-IR value. This checks insulin sensitivity and resistance.
- They also have a 1.63 mg/dL higher level of HDL-C. It’s the good cholesterol that helps eliminate bad cholesterol from the body.
How Long Does It Take to Reverse Type 2 Diabetes?
A study showed that it took about a year to reverse type 2 diabetes and stay off of anti-diabetic drugs [23]. The study comprised of diabetic individuals who were divided into two — intervention and control groups. The intervention group underwent:
- Total diet replacement for three to five months
- Stepped food reintroduction
- Withdrawal of medications for diabetes and hypertension
- Structured support and program for weight loss maintenance
Of the 149 people in the intervention group, 46% or 68 of them achieved diabetes remission at 12 months. Only 4% (6) of the control group reversed their type 2 diabetes [23].
Two years after the study, 70% of those who achieved diabetes remission in the first year maintained or sustained their remission [22].
Another study also showed that going on a low-calorie, healthy diet can reverse type 2 diabetes in the short term for about two years [17].
It’s possible to reverse type 2 diabetes or at least prevent complications. According to the CDC [37]:
- Controlling blood sugar levels reduces eye, kidney, and nerve damage by 40%.
- Blood pressure control reduces stroke and heart problems by 33% to as high as 50%.
- Lowering bad cholesterol levels reduces heart risks by 20% to 50%.
Getting regular checkups, proper patient education, and timely treatment also helps reduce the risk of [37]:
- Blindness caused by diabetes by up to 90%.
- Amputation by up to 85%.
- Kidney function decline by 33% to 37%.
Type 2 diabetes and prediabetes are highly preventable, and about 90% of their cases can be prevented by living a healthier lifestyle [34].
![]()

Final Thoughts
Diabetes affects about 11.3% or 37.3 million American adults, 90.9% of which have type 2 diabetes. It also affects 283,000 American children and adolescents less than 20 years of age, 86.2% of which have type 1 diabetes.
Diabetes costs the country $327 billion in 2017. It costs diabetics $16,752 annually in healthcare costs. It’s 2.3 times higher than what non-diabetics spend on healthcare costs at $7,151.
Diabetes awareness and lifestyle changes can help manage diabetes. These measures can also help reverse type 2 diabetes and reduce its complications.
References
- American Diabetes Association. (2008). Economic Costs of Diabetes in the U.S. in 2007. Diabetes Care, 31(3), 596–615. [1]
- American Diabetes Association. (2018). Economic Costs of Diabetes in the U.S. in 2017. Diabetes Care, 41(5), 917–928. [2]
- Behavioral Risk Factor Surveillance System. (2022). Centers for Disease Control and Prevention. [3]
- Bullard, K. M., Cowie, C. C., Lessem, S. E., Saydah, S. H., Menke, A., Geiss, L. S., Orchard, T. J., Rolka, D. B., & Imperatore, G. (2018). Prevalence of Diagnosed Diabetes in Adults by Diabetes Type — United States, 2016. MMWR. Morbidity and Mortality Weekly Report, 67(12), 359–361. [4]
- CDC Wonder. (2022). Centers for Disease Control and Prevention. [5]
- Centers for Disease Control and Prevention. (2018). National Diabetes Statistics Report. National Diabetes Statistics Report. [6]
- Centers for Disease Control and Prevention. (2020a). Prevalence of Both Diagnosed and Undiagnosed Diabetes. National Diabetes Statistics Report. [7]
- Centers for Disease Control and Prevention. (2020b). Prevalence of Diagnosed Diabetes. National Diabetes Statistics Report. [8]
- Diabetes and African Americans. (2014). The Office of Minority Health. [9]
- Diagnosis. (2016). American Diabetes Association. [10]
- Elflein, J. (2022). Diagnosed diabetes total U.S. number 1980-2019. Statista. [11]
- Forecasting Obesity and Type 2 Diabetes Incidence and Burden: The ViLA-Obesity Simulation Model. (2022). Frontiers in Public Health, 10. [12]
- Geiss, L. S., Li, Y., Hora, I., Albright, A., Rolka, D., & Gregg, E. W. (2018). Resurgence of Diabetes-Related Nontraumatic Lower-Extremity Amputation in the Young and Middle-Aged Adult U.S. Population. Diabetes Care, 42(1), 50–54. [13]
- Gestational Diabetes. (2015). Centers for Disease Control and Prevention. [14]
- Gregg, E. W., Sophiea, M. K., & Weldegiorgis, M. (2021). Diabetes and COVID-19: Population Impact 18 Months Into the Pandemic. Diabetes Care, 44(9), 1916–1923. [15]
- Gregory, E. C. W., & Ely, D. M. (2022). Trends and Characteristics in Gestational Diabetes: United States, 2016–2020. National Vital Statistics Reports, 71(3). [16]
- Hallberg, S. J., Gershuni, V. M., Hazbun, T. L., & Athinarayanan, S. J. (2019). Reversing Type 2 Diabetes: A Narrative Review of the Evidence. Nutrients, 11(4), 766. [17]
- Hayes, T. O., & Farmer, J. (2020). Insulin Cost and Pricing Trends. American Action Forum. [18]
- Hoffstad, O., Mitra, N., Walsh, J., & Margolis, D. J. (2015). Diabetes, Lower-Extremity Amputation, and Death. Diabetes Care, 38(10), 1852–1857. [19]
- International Diabetes Federation. (2022). IDF Diabetes Atlas: 10th Edition. [20]
- Landstra, C. P., & de Koning, E. J. P. (2021). COVID-19 and Diabetes: Understanding the Interrelationship and Risks for a Severe Course. Frontiers in Endocrinology, 12. [21]
- Lean, M. E. J., Leslie, W. S., Barnes, A. C., Brosnahan, N., Thom, G., McCombie, L., Peters, C., Zhyzhneuskaya, S., Al-Mrabeh, A., Hollingsworth, K. G., Rodrigues, A. M., Rehackova, L., Adamson, A. J., Sniehotta, F. F., Mathers, J. C., Ross, H. M., McIlvenna, Y., Welsh, P., Kean, S., . . . Taylor, R. (2019). Durability of a primary care-led weight-management intervention for remission of type 2 diabetes: 2-year results of the DiRECT open-label, cluster-randomised trial. The Lancet Diabetes & Endocrinology, 7(5), 344–355. [22]
- Lean, M. E., Leslie, W. S., Barnes, A. C., Brosnahan, N., Thom, G., McCombie, L., Peters, C., Zhyzhneuskaya, S., Al-Mrabeh, A., Hollingsworth, K. G., Rodrigues, A. M., Rehackova, L., Adamson, A. J., Sniehotta, F. F., Mathers, J. C., Ross, H. M., McIlvenna, Y., Stefanetti, R., Trenell, M., . . . Taylor, R. (2018). Primary care-led weight management for remission of type 2 diabetes (DiRECT): an open-label, cluster-randomised trial. The Lancet, 391(10120), 541–551. [23]
- Narayan, K. M. V., Boyle, J. P., Thompson, T. J., Sorensen, S. W., & Williamson, D. F. (2003). Lifetime Risk for Diabetes Mellitus in the United States. JAMA, 290(14), 1884–1890. [24]
- National Institute of Diabetes and Digestive and Kidney Diseases. (2021). Reducing Disparities in Diabetic Amputations. National Institutes of Health. [25]
- Nguyen, A., & Mui, K. (2020). The Staggering True Cost of Diabetes. GoodRx. [26]
- Park, J. H., Moon, J. H., Kim, H. J., Kong, M. H., & Oh, Y. H. (2020). Sedentary Lifestyle: Overview of Updated Evidence of Potential Health Risks. Korean Journal of Family Medicine, 41(6), 365–373. [27]
- Penner, E. A., Buettner, H., & Mittleman, M. A. (2013). The Impact of Marijuana Use on Glucose, Insulin, and Insulin Resistance among US Adults. The American Journal of Medicine, 126(7), 583–589. [28]
- People With Diabetes Can Live Longer by Meeting Their Treatment Goals. (2022). Centers for Disease Control and Prevention. [29]
- PLOS. (2022). Poor diet associated with increased diabetes risk across all gradients of genetic risk: A poor diet, irrespective of genetic risk factors, is associated with a 30 percent increased risk of diabetes. ScienceDaily. [30]
- Prediabetes - Your Chance to Prevent Type 2 Diabetes. (2014). Centers for Disease Control and Prevention. [31]
- Rowley, W. R., & Bezold, C. (2012). Creating Public Awareness: State 2025 Diabetes Forecasts. Population Health Management, 15(4), 194–200. [32]
- Saydah, S. H. (2018). Medication Use and Self-Care Practices in Persons With Diabetes. In Diabetes in America (3rd ed.). National Institute of Diabetes and Digestive and Kidney Diseases (US). [33]
- Simple Steps to Preventing Diabetes. (2012). Harvard T.H. Chan School of Public Health. [34]
- Statistics About Diabetes. (2022). American Diabetes Association. [35]
- Tamura, R. E., Said, S. M., de Freitas, L. M., & Rubio, I. G. S. (2021). Outcome and death risk of diabetes patients with Covid-19 receiving pre-hospital and in-hospital metformin therapies. Diabetology & Metabolic Syndrome, 13(1). [36]
- The Health and Economic Benefits of Diabetes Interventions. (2020). Centers for Disease Control and Prevention. [37]
- Weiss, L., Zeira, M., Reich, S., Har-Noy, M., Mechoulam, R., Slavin, S., & Gallily, R. (2006). Cannabidiol lowers incidence of diabetes in non-obese diabetic mice. Autoimmunity, 39(2), 143–151. [38]
- Weiss, L., Zeira, M., Reich, S., Slavin, S., Raz, I., Mechoulam, R., & Gallily, R. (2008). Cannabidiol arrests onset of autoimmune diabetes in NOD mice. Neuropharmacology, 54(1), 244–249. [39]
