
Autism Statistics: How Many People Have Autism?

Report Highlights:
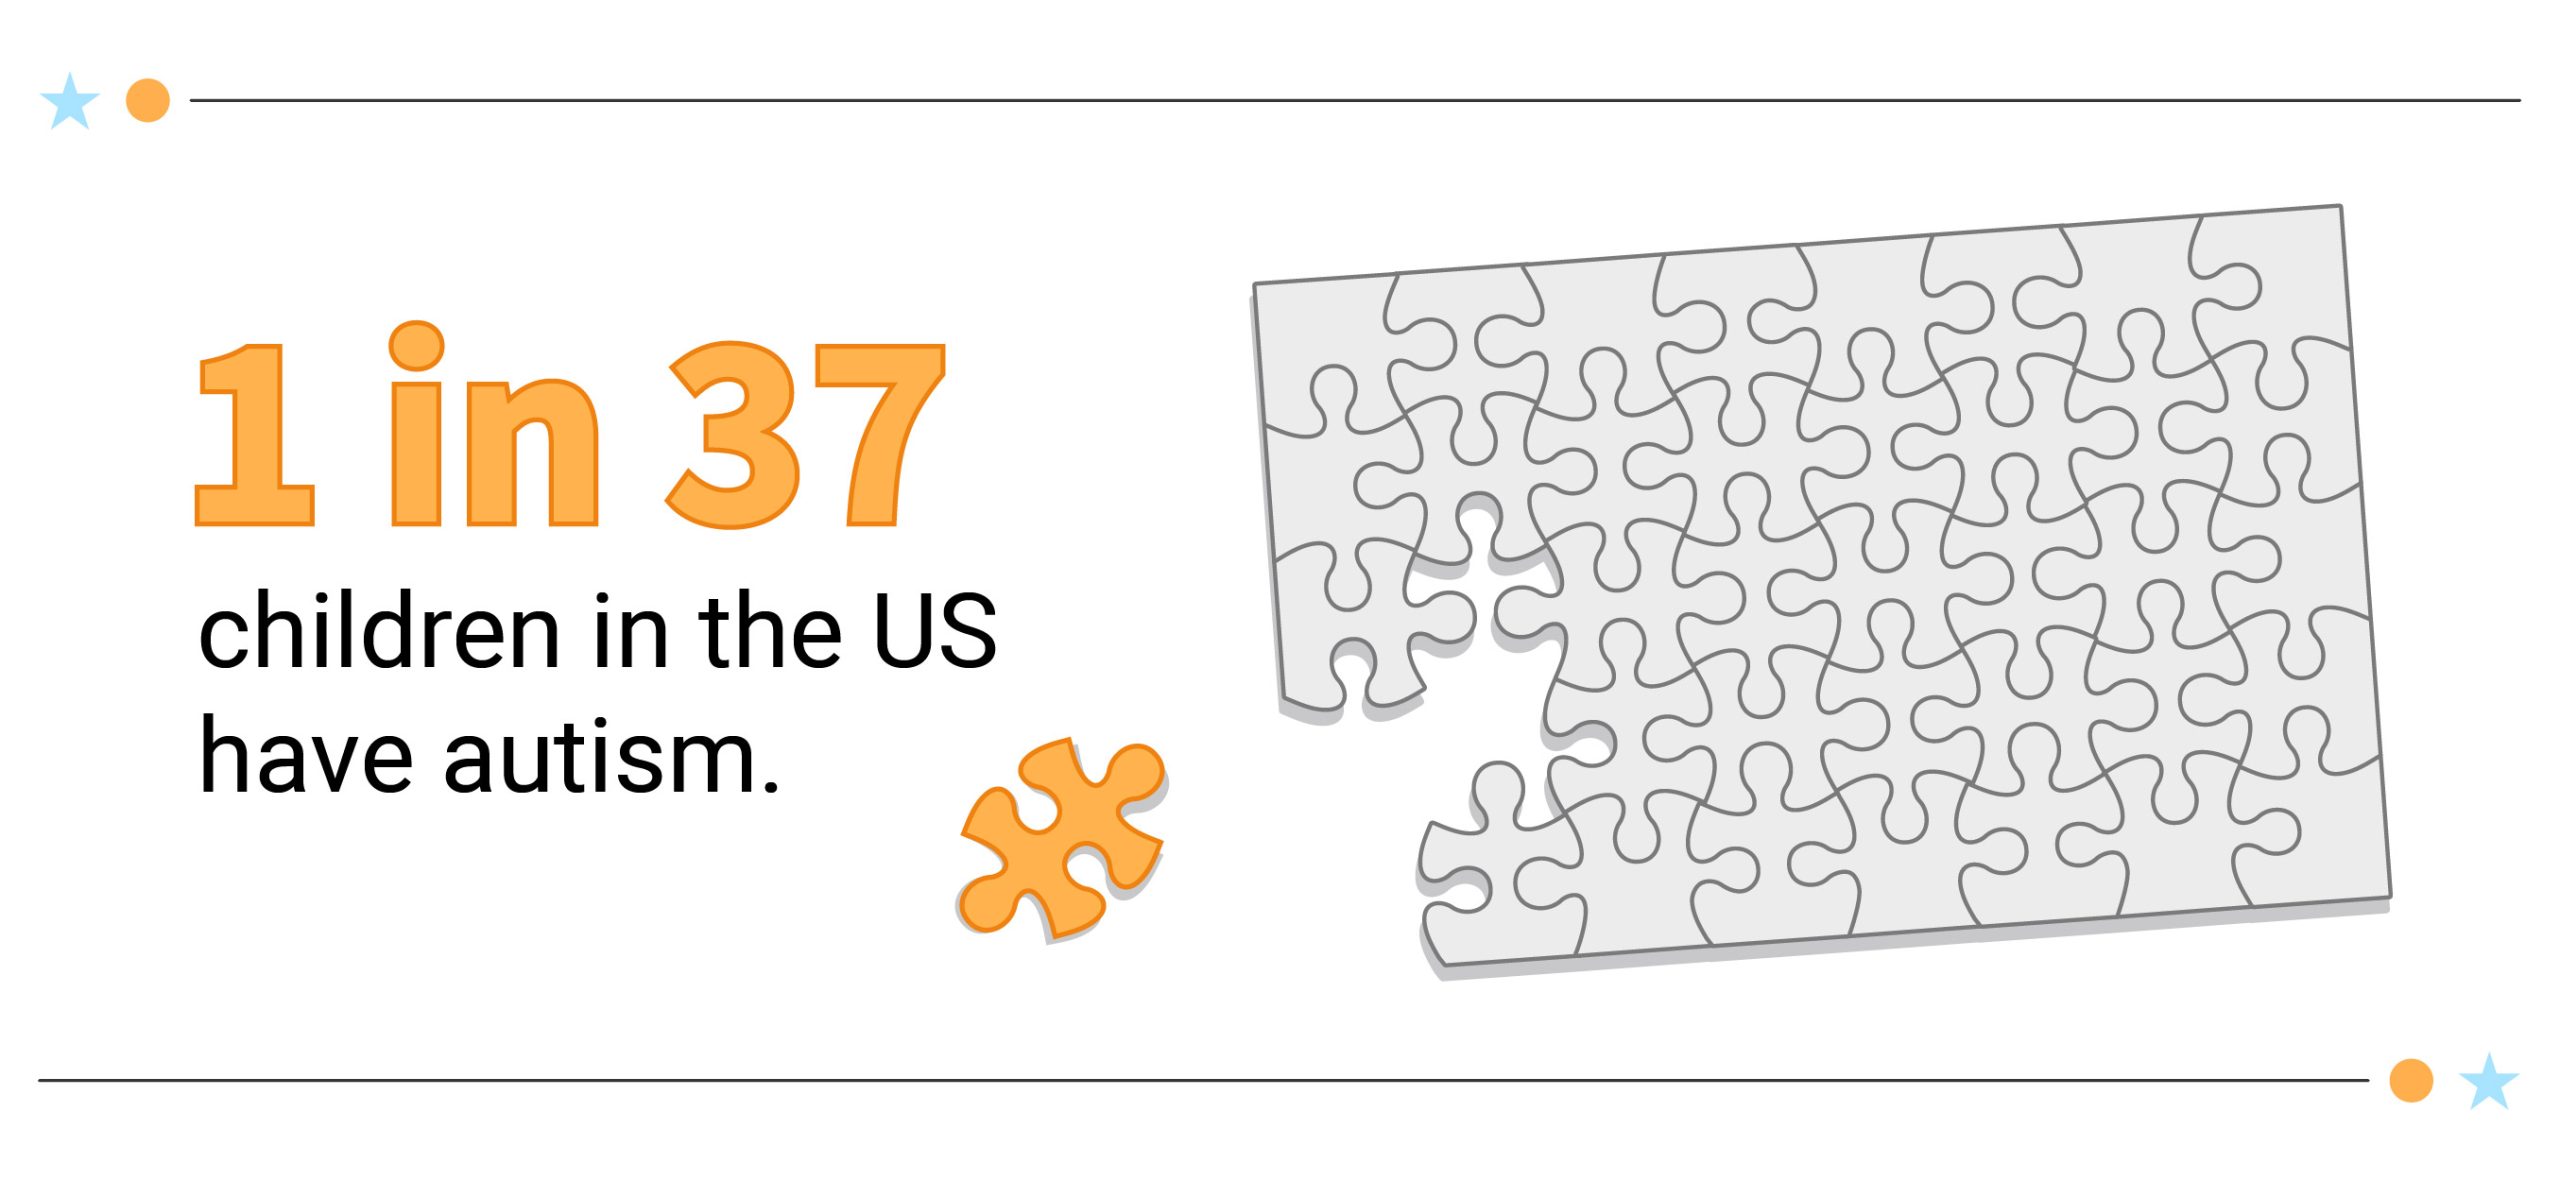
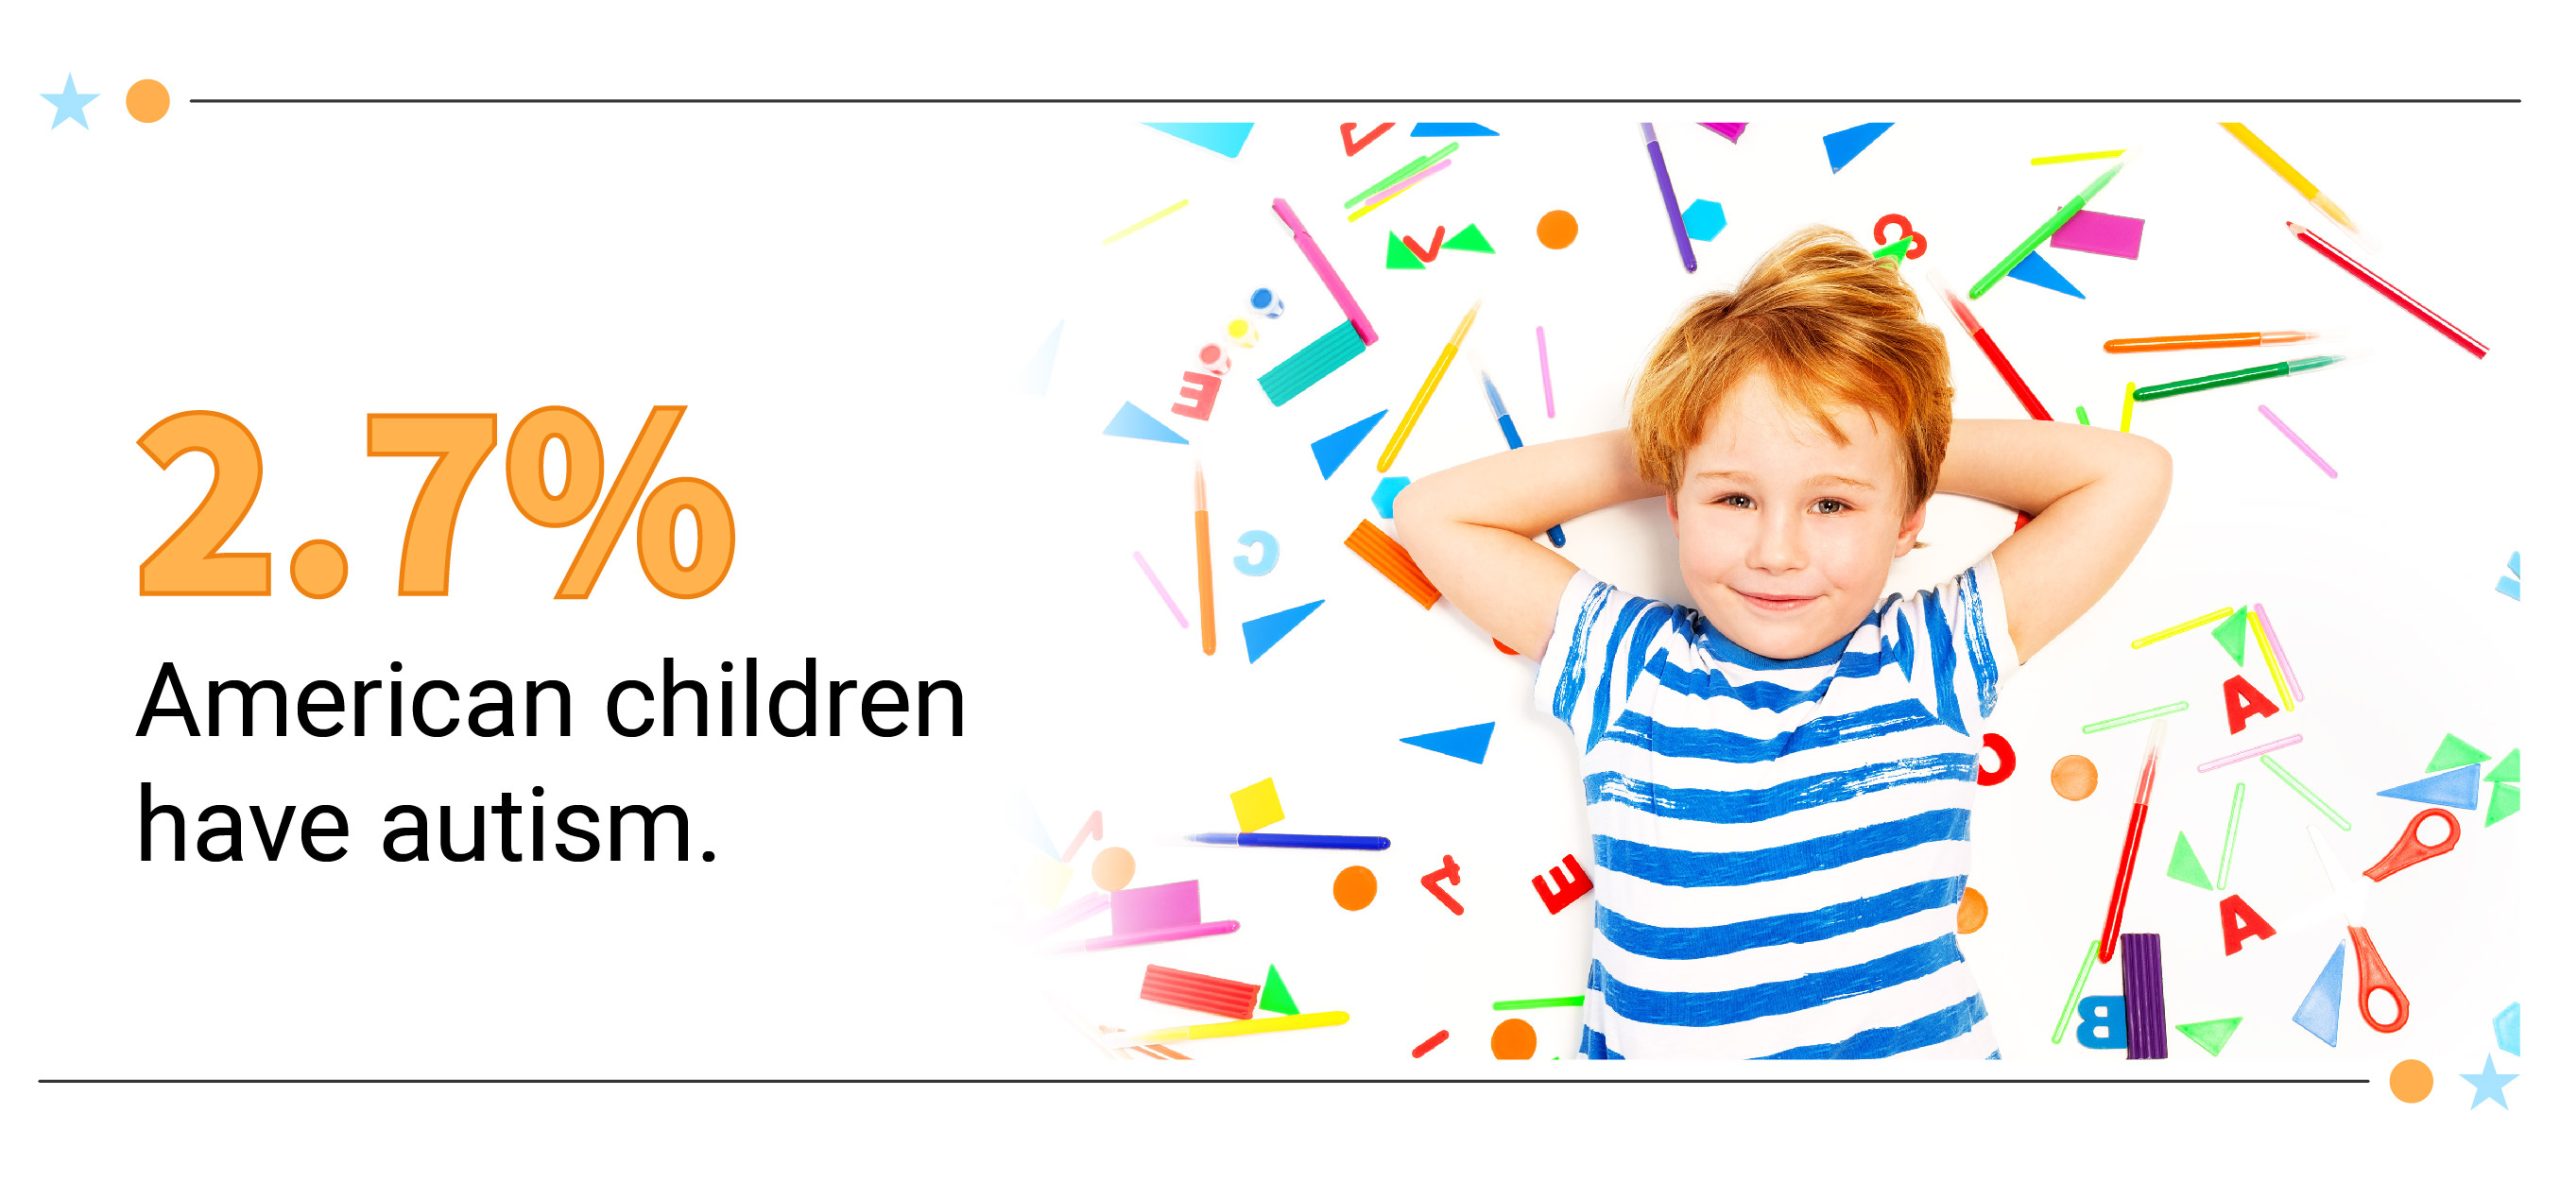
- 2.7%, 1.67 million, or 1 in 37 children (3 to 17 years old) in the US have autism [30].
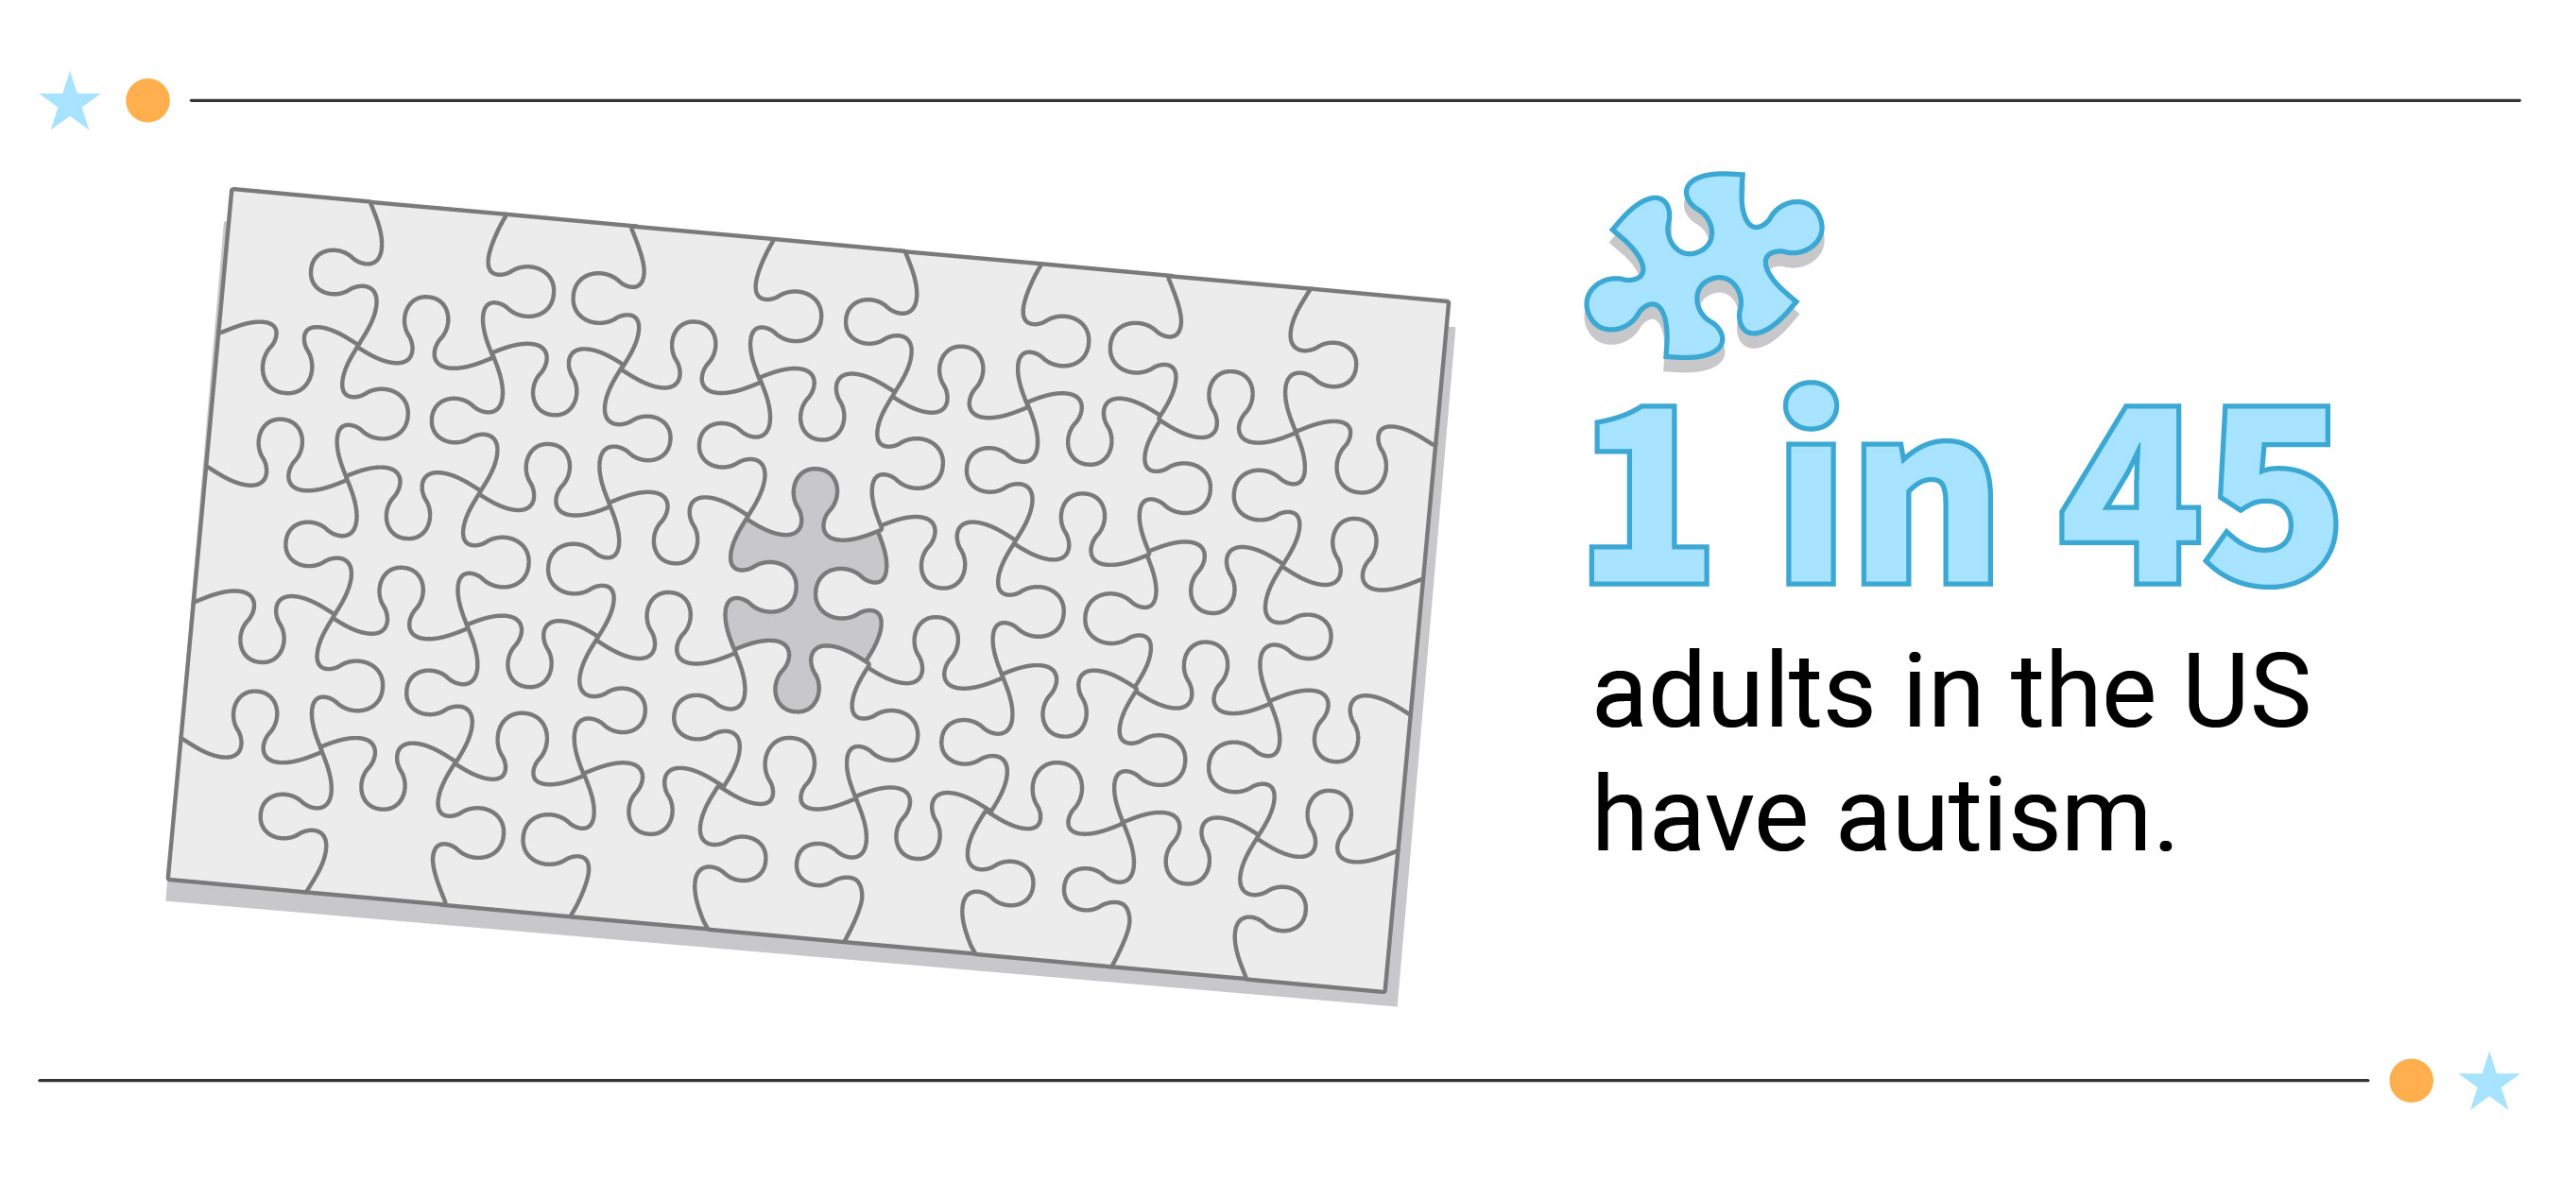
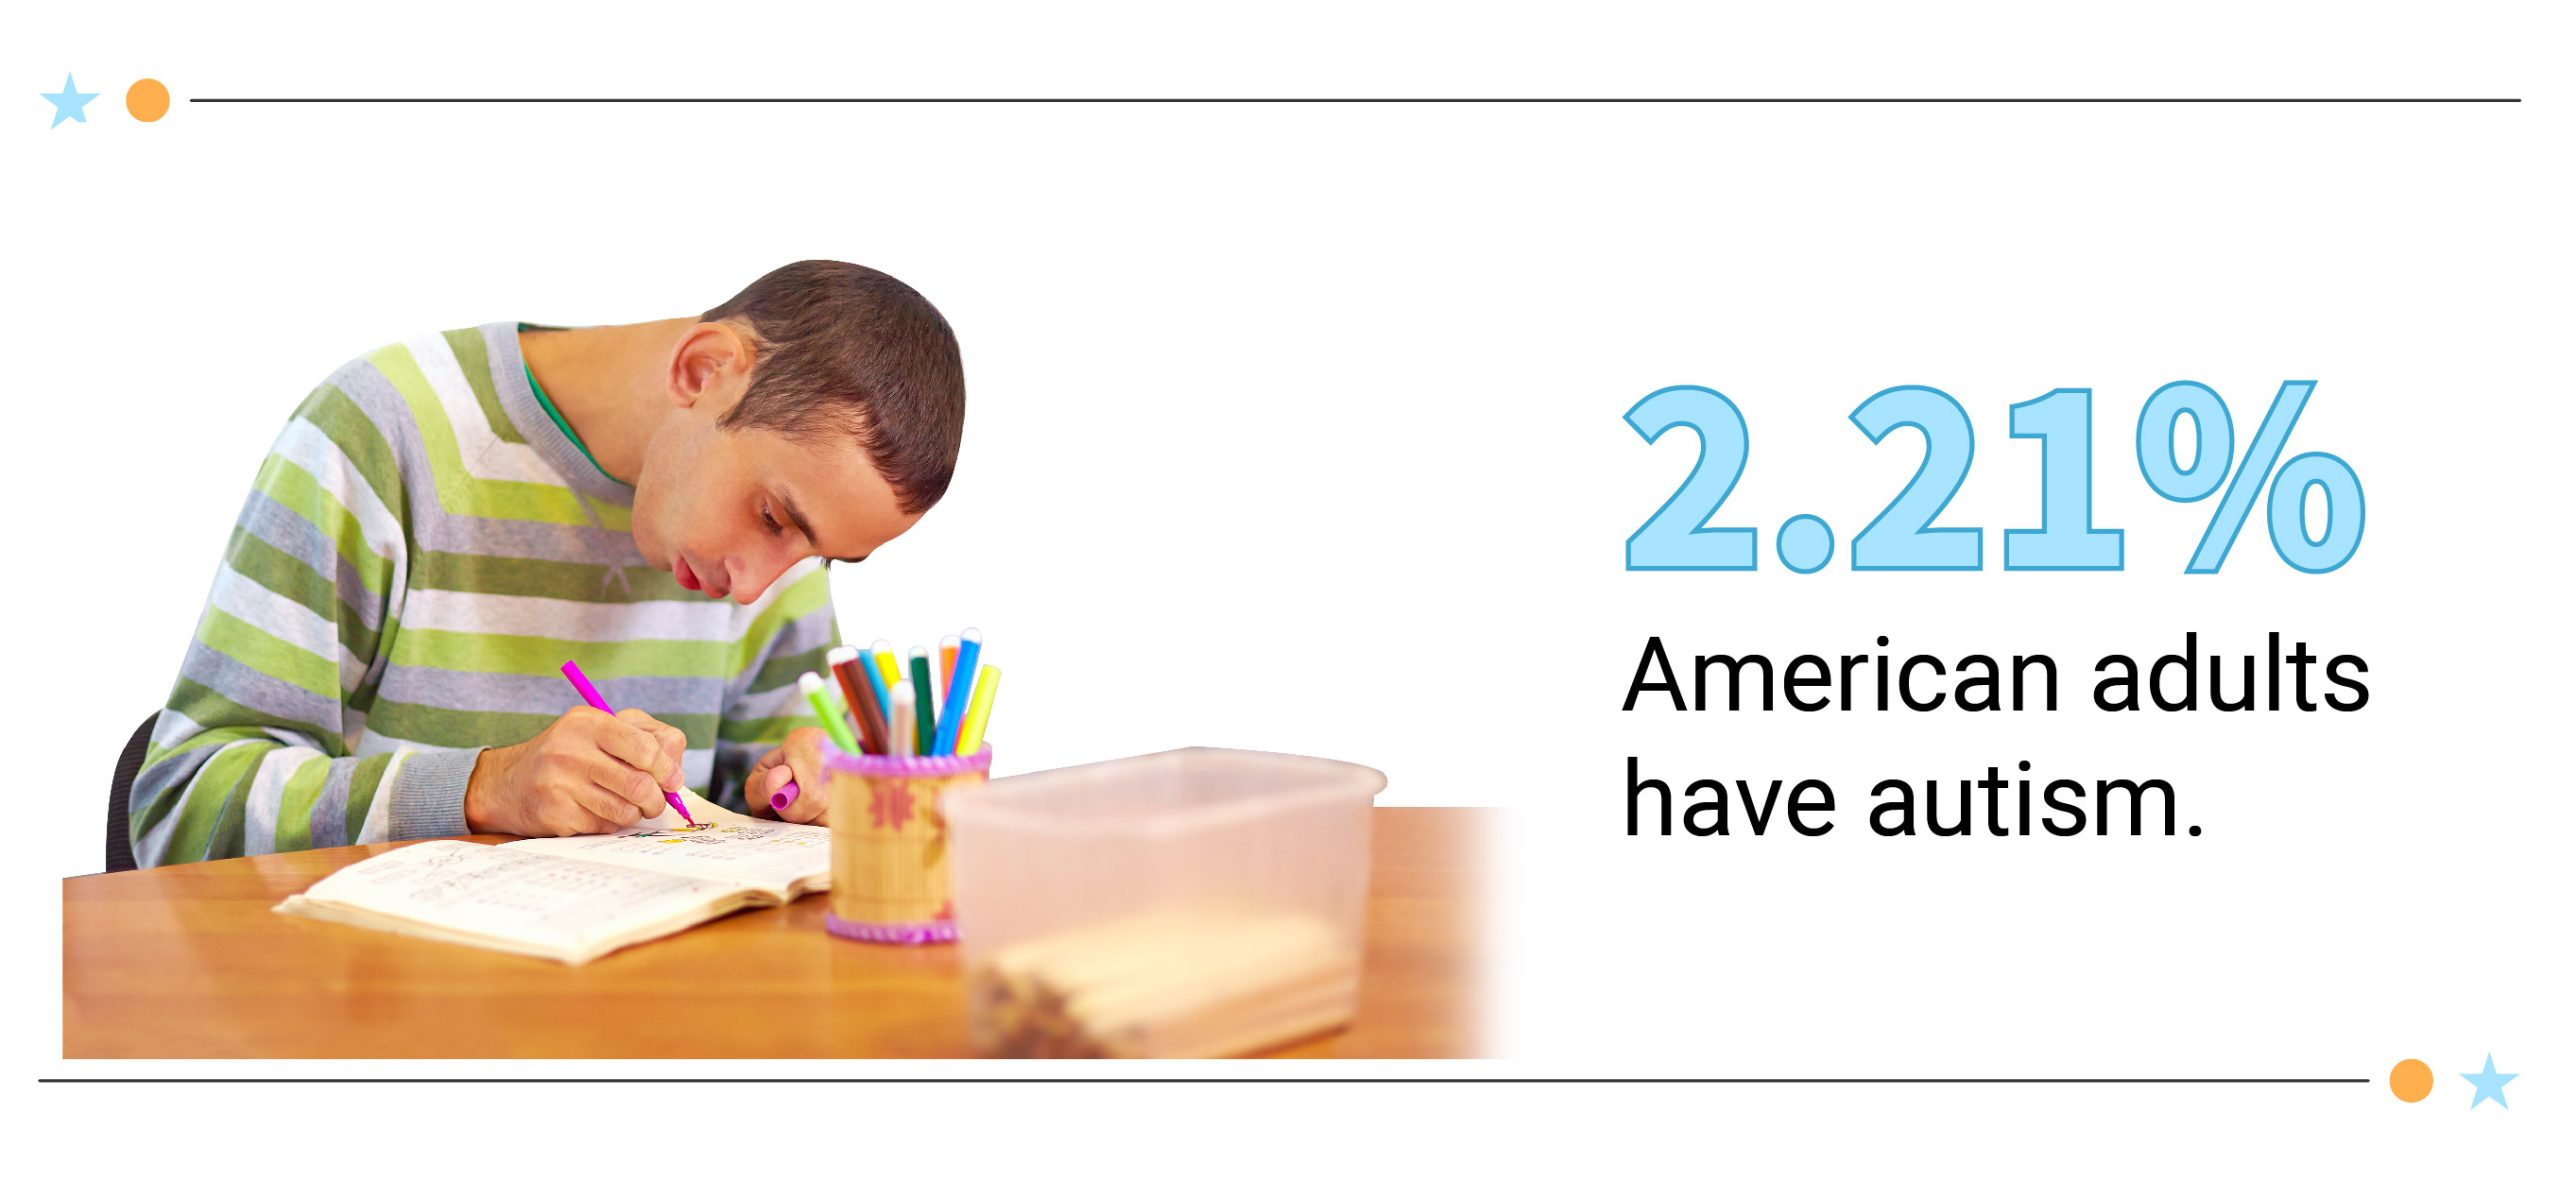
- 2.21%, 5.44 million, or 1 in 45 adults (18 and older) in the US have autism [11].
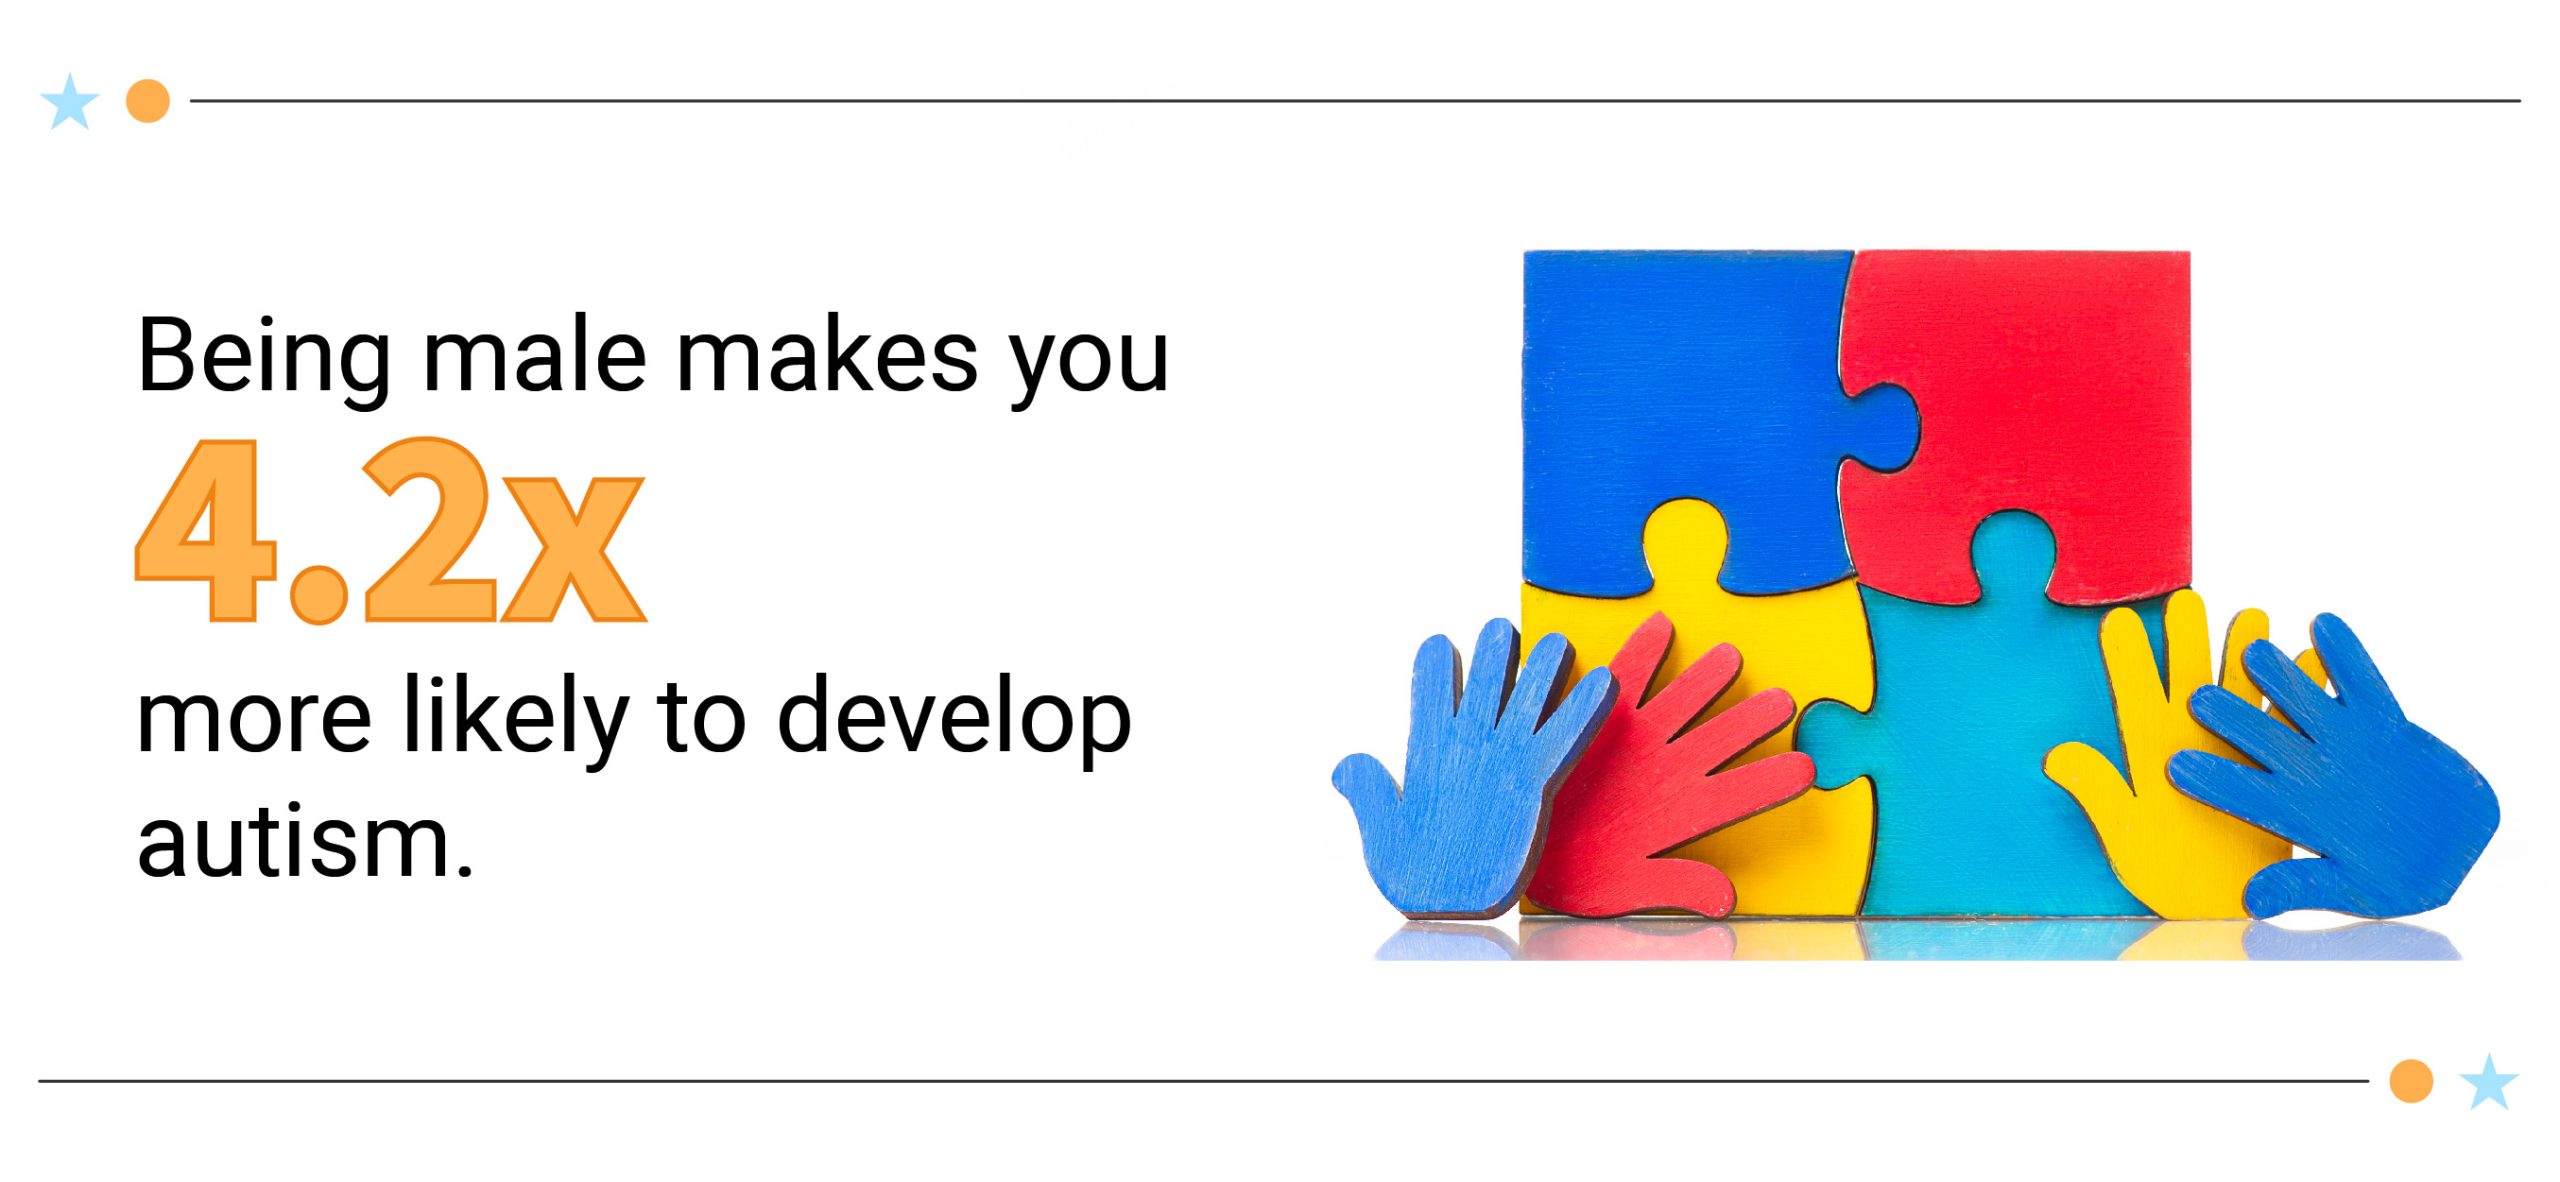
- Boys are 4.2 times more likely to receive an autism diagnosis than girls. It affects 4.3% of boys and 1.1% of girls [25] [30].
- Autism affects older children (12 to 17 years) the most at 3.1% [30].
- Autism commonly occurs among White American children at 3.0% [30].
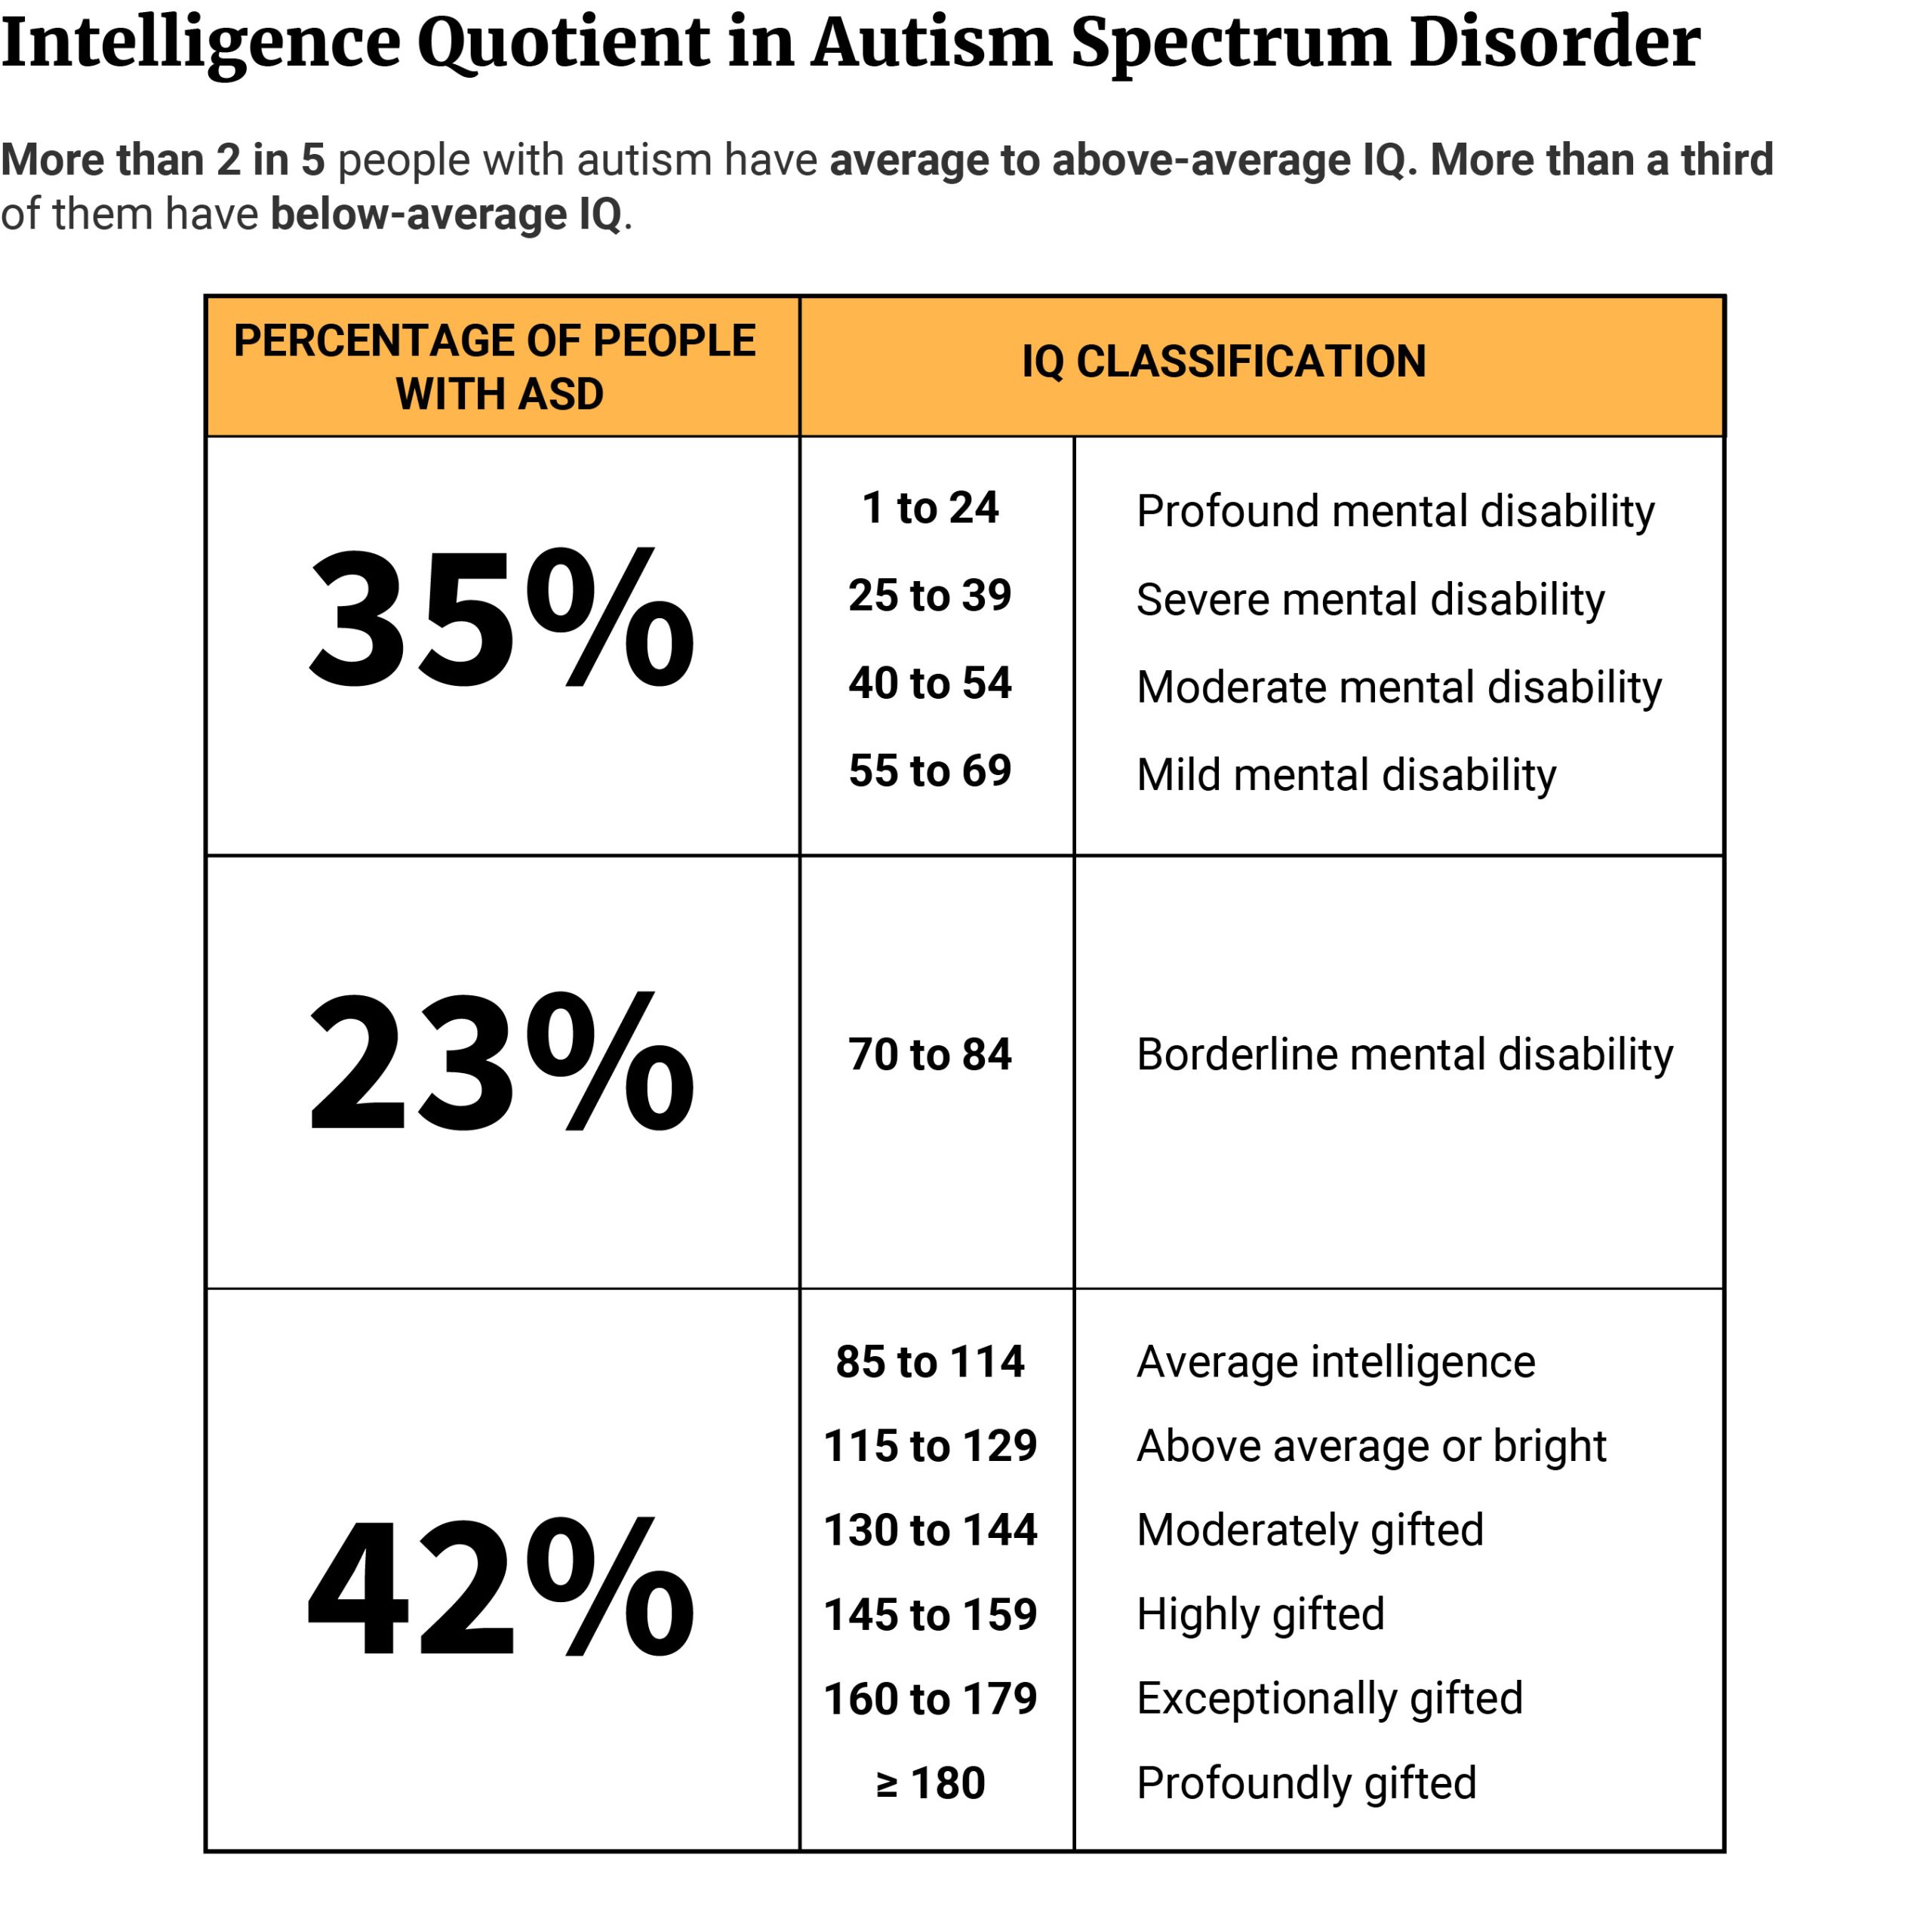
- 41.7% of people with autism have > 85 IQ and 23.1% have IQ of 71 to 85 [25].
- 25% to 35% of autistic children are minimally verbal and 25% are non-verbal [38] [45].
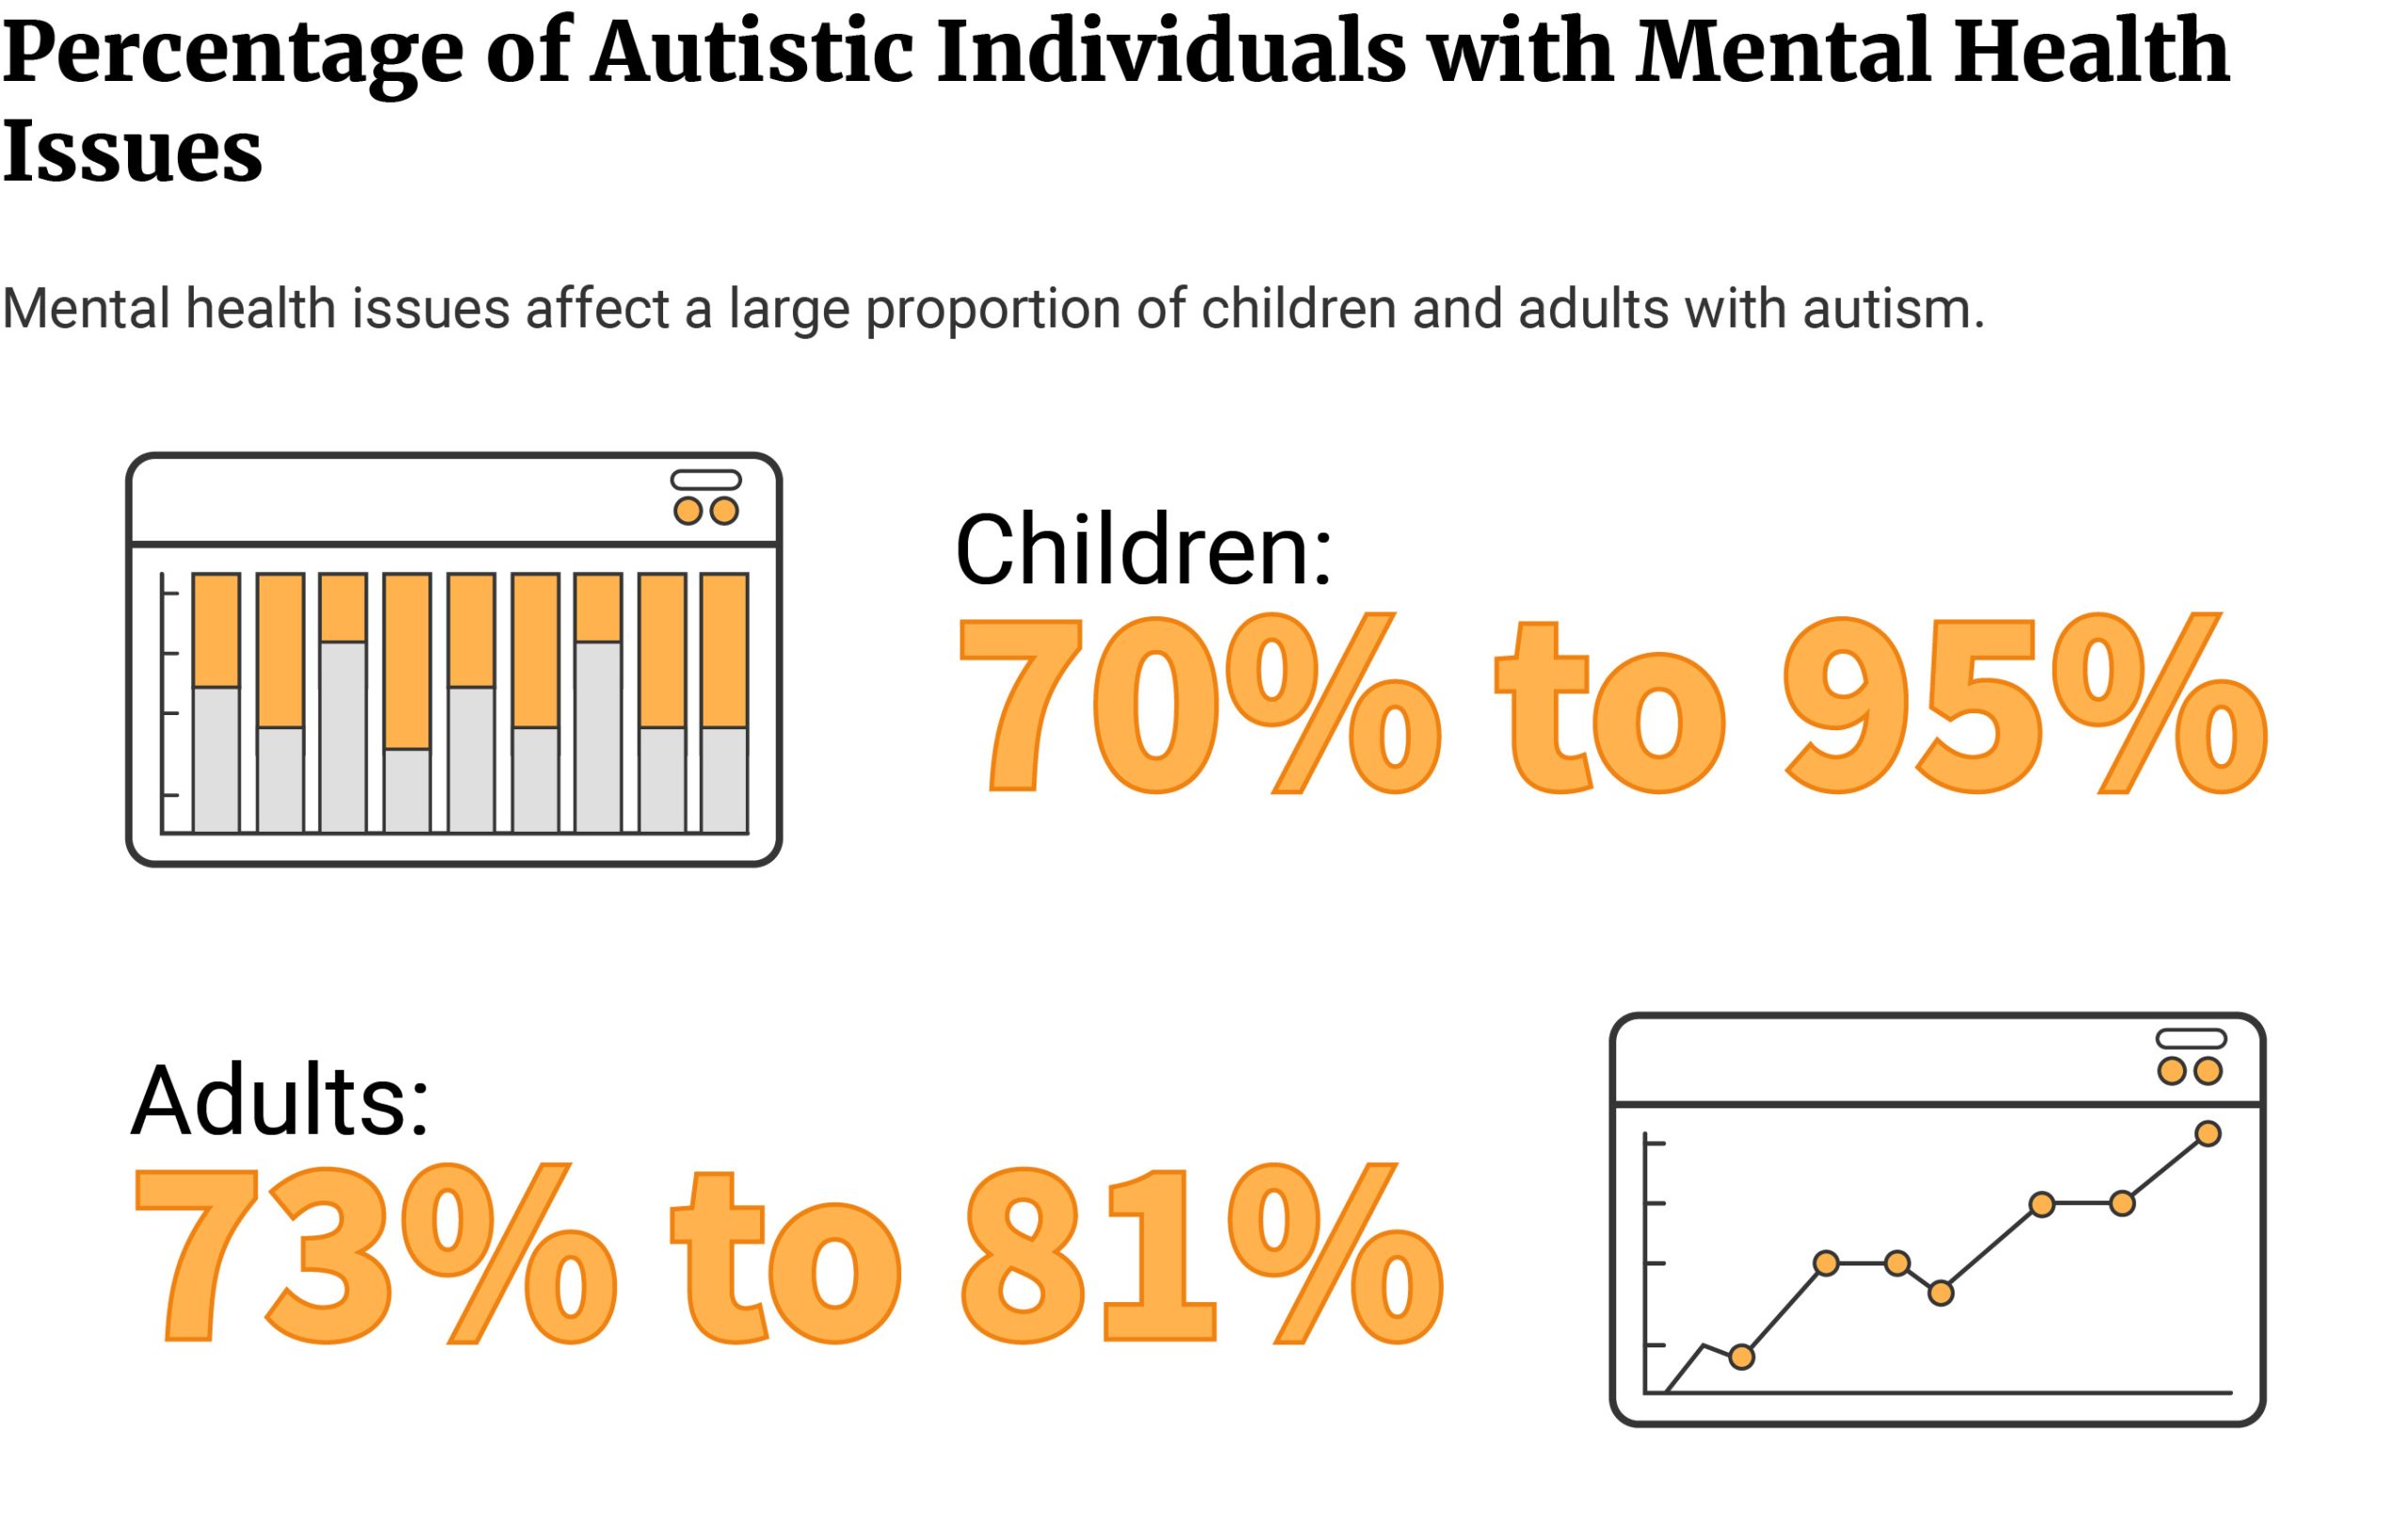
- 70% to 95% of children with autism (17 and younger) have one or more mental illnesses [29].
- The best state to raise a child with autism is Montana and the worst state is West Virginia [31].
- Autism could have cost the US $223 billion in 2020. Autism’s costs could increase to $5.54 trillion in 2060 [5].
- Caring for an autistic child costs $4,110 to $6,200 more than caring for a child without autism [42].
- Intensive behavioral therapy costs families of autistic children an additional $40,000 to $60,000 per year [43].
- 29.5% of children with autism do not receive any treatment or therapy [47].
- Untreated autism is highest among uninsured children at 70.4% [47].
- 28% to 74% of children with autism receive complementary alternative treatment [21].
Autism is the same as autism spectrum disorders. The latter is simply its clinical definition. Three core deficits characterize autism:
- Impaired reciprocal communication skills
- Impaired or poorly-developed social interaction skills
- Presence of repetitive, restrictive, and stereotypic behavior
The signs and symptoms of this neurodevelopmental disorder commonly appear in early childhood. However, diagnosis often comes much later, when the child starts school.
In the US, 1 in 37 children and 1 in 45 adults are diagnosed with autism [11] [30].

These numbers have gone up over the years. One MIT senior researcher even predicted that, by 2025, 50% of all children will have autism [40].
Is there truth to this?
Read on to discover the most current facts and statistics on autism.
Causes of Autism
Genes account for 40% to 80% of the risks associated with the development of autism [39]. However, another study said that genes and the heritability of autism account for only 55% of the risk [7].
Environmental factors account for about 40% to 50% of autism risks. Inorganic mercury exposure during pregnancy, for example, increases autism risk by 60% [28].
Older parental age also plays a role. For every 10-year increase in the mother’s age, the child’s risk of developing autism increases by 18%. Every 10-year increase in the father’s age, on the other hand, increases autism risk by 21% [28].
Pregnancy-related complications, the mom’s medical condition, and medications also play a role [28].
- Cesarean section increases risk by 36%.
- Being overweight increases autism risk by 28%. The risk increases to 36% if the mother is obese.
- Maternal genitourinary infection increases autism risk by 9%. If the mother develops a bacterial infection, the risk doubles and increases to 18%.
- Pregestational and gestational diabetes increase autism risk by 74% and 43%, respectively.
- Mothers with autoimmune diseases increase their baby’s risk of developing ASD by 49% to 64%. These include conditions like rheumatoid arthritis, autoimmune thyroid disease, psoriasis, and diabetes.
- A baby’s autism risk increases by 50% if the mother uses selective serotonin reuptake inhibitors (SSRIs) during pregnancy.
Types of Autism
The old DSM-IV used to include five types of autism [18]:
- Autistic disorder
- Asperger’s disorder
- Pervasive neurodevelopmental disorder, not otherwise specified (PDD-NOS)
- Rett’s disorder
- Childhood disintegrative disorder (CDD) or Heller syndrome
When the American Psychiatric Association (APA) updated to DSM-5 in 2013, it removed Rett’s disorder and CDD [32].
Rett’s syndrome became its own separate disease entity. Researchers found it’s caused by the mutation of a specific gene called MECP2 [35].
As for the other types of autism, they were absorbed into the broader umbrella diagnosis of ASD [18].
Today, we no longer consider them as separate diagnoses. Instead, doctors give people exhibiting their symptoms the blanket diagnosis of ASD.
We’re also no longer using the terms high and low functioning. We used these terms before to classify autism based on the severity of symptoms. However, these terms are limiting, stigmatizing, and can set misleading expectations. These can cause barriers that prevent them from receiving proper support.
The linear classification of mild, moderate, and severe autism also doesn't capture the neurodiversity of ASD. ASD symptoms, needs, and even strengths overlap and differ in intensity. These change as they grow older, interact with their environment, and learn new skills.
Because of these, the autism pie chart or wheel model becomes more representative of ASD.
The Autism Pie Chart Model
Think of the autism pie chart or wheel model as a spectrum color wheel with concentric circles [6].
The number of colors and concentric circles differ. Some health professionals use five colors, while others ten. Some pie charts have five concentric circles, some have ten.
Each color represents a skill, function, or autistic trait. These can include:
- Language Skills
- Social Skills
- Motor Skills
- Sensory Sensitivity
- Executive Skills
- Cognitive Function
Some pie charts also include more detailed autistic traits and characteristics.
- Anxiety
- Depression
- Aggression
- Meltdowns
- Sensory sensitivities to noise, touch, light, texture, etc.
- Stimming, fidgeting, and tics
- Social difficulties
- Communication problems like flat speech
- Poor eye contact
- Restricted interests and fixations
- Need for specific routines
- Difficulty understanding emotions
- Poor posture and gait
- Executive functions and self-regulation skills like self-control, working memory, and mental flexibility
- Cognitive functions like memory, decision-making, learning, language, perception, and attention
The concentric circles represent degrees — from lowest (innermost circle) to highest (outermost circle).
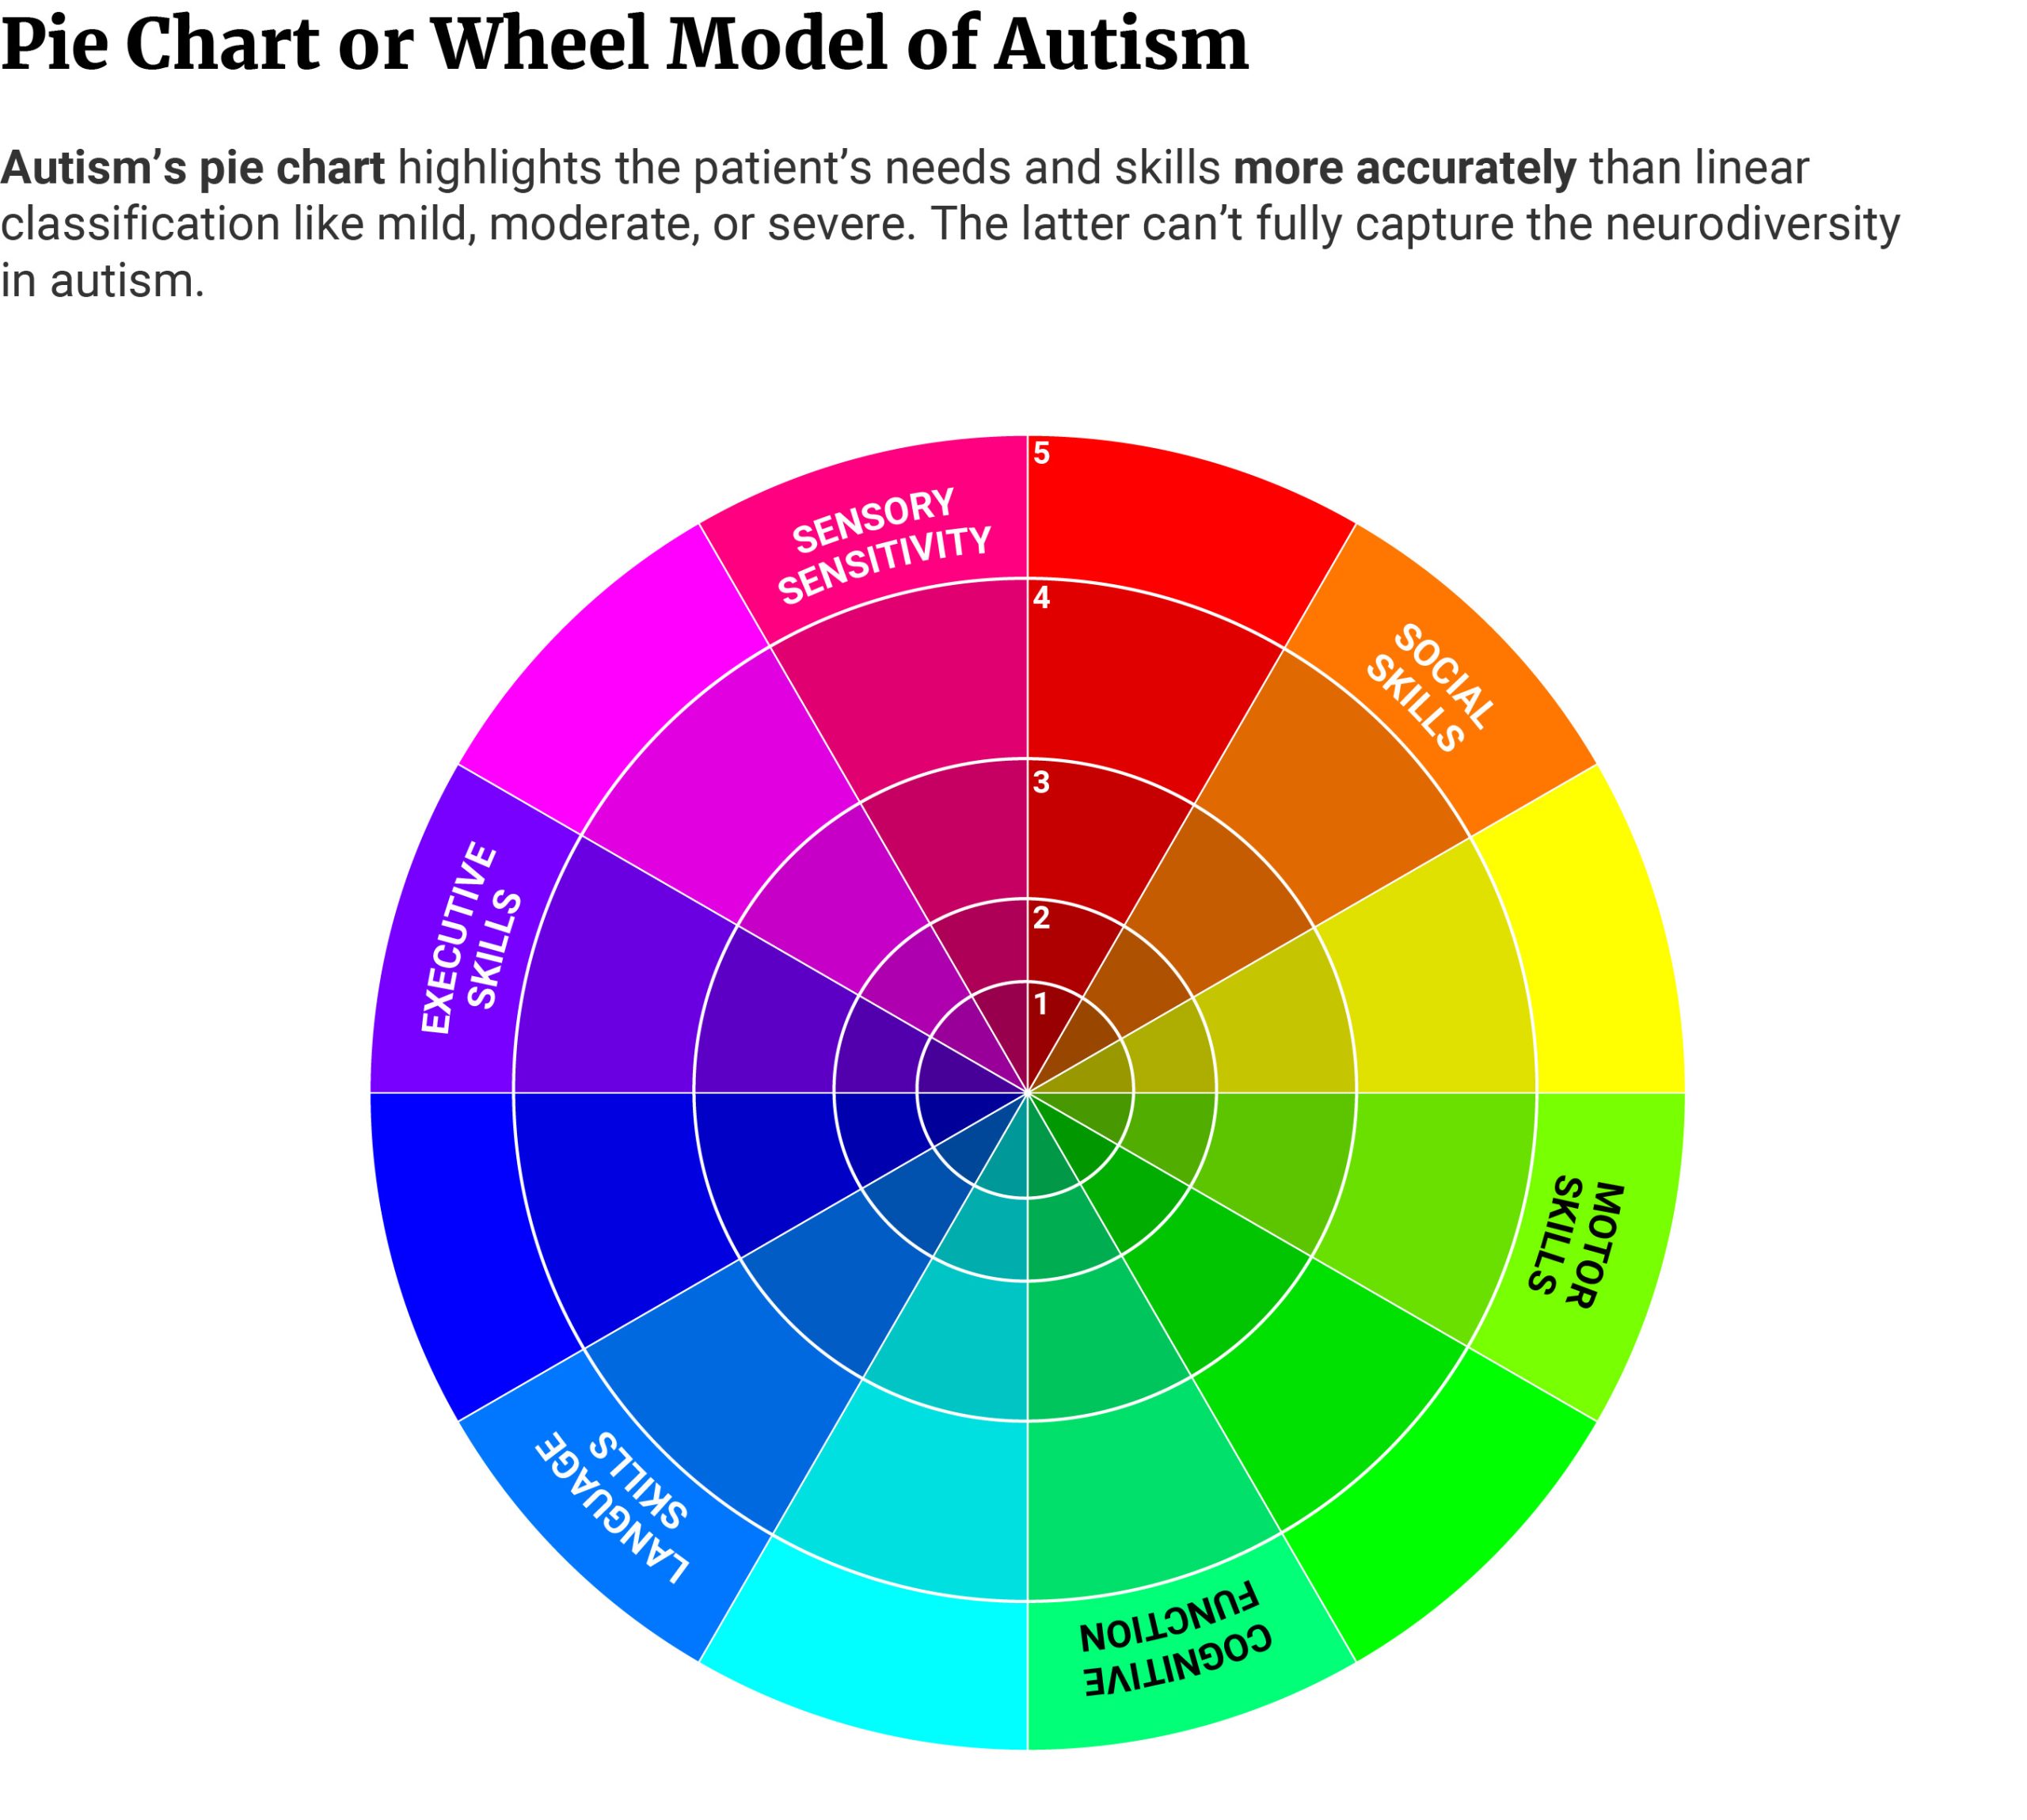

To use the chart, the health practitioner asks the patient or caregiver questions about their traits, skills, needs, strengths, or weaknesses and plots the answers on the pie model.
For example, an autistic person may score a 4/5 in motor skills and a 3/5 in sensory skills. However, they may score a low 1/5 in social skills.
From the information, the health practitioner can recommend the appropriate treatment and therapies.
Autistic individuals exhibit varying symptoms. An autism pie chart highlights the patient’s traits and needs more accurately than a linear classification. It also helps doctors provide them with better support to meet autism challenges.
Autism Challenges
41.7% of autistic children have an IQ of more than 85 [25]. This can range from average intelligence to profoundly gifted (IQ of 180 and above) [8].
35.2% have an IQ of 70 and below [25]. Autistic people who fall into this category have an intellectual disability. It can range from mild mental disability to profound mental disability (IQ of 24 and below) [8].
23.1% have an IQ of 71 to 85 or borderline mental disability [8] [25].

25% to 35% of children with ASD are minimally verbal with about one to 50 words [2] [38].
25% are non-verbal and communicate with people through sounds [2] [45].
Autism Spectrum Disorder and Comorbid Mental Illness
70% to as high as 95% of autistic children and adolescents have at least one mental health issue [29].
41% to as high as 60% of them have two or more mental health issues, while 24% have three or more [29].
73% to 81% of adults with autism also deal with at least one mental health problem [29].

28% of people with autism have attention-deficit hyperactivity disorder (ADHD) [4].
20% have anxiety disorders, while 11% have depression [4].
42% have self-injurious behaviors [4].
Autism Spectrum Disorder and Bullying
19.2% of parents with autistic children say their children are being bullied. Only 4.6% of parents of community children report the same [20].
It should be noted, too, that children with ASD can also be perpetrators of bullying.
10.3% of parents say their autistic children are involved in bullying and teasing others. 2.1% of parents of community children report the same [20].
Autism Prevalence: How Many People Have Autism?
1 in 37 children has an autism diagnosis [30]. Autism spectrum disorder occurs in 1 in 45 adults [11].
Data for children came from the 2020 National Survey of Children’s Health. Data for adults came from CDC’s 2017 ASD Report.
25.2% of 8 years old children at the time of study have undiagnosed autism. 53.9% of them come from minorities [46].
Researchers analyzed the medical and educational records of 266,000 children [46].
- Of the 266,000, 1.7% or 4,498 children showed signs of ASD.
- Of the 1.7%, 25.2% or 1,135 children don’t have an autism diagnosis despite exhibiting symptoms.
- Of the 25.23%, 55.3% or 628 children have not received any school-based autism services.
- Of those with undiagnosed autism, 45.2% are Whites, 27.5% are Blacks, and 18.1% are Hispanics. Non-Hispanics, other ethnicities make up 8.3%. 0.9% are unknown.
Autism in Childhood Statistics: How Many Children Have Autism?
About 2.7% of American children (3 to 17 years) have ASD [30].
This translates to 1.67 million children and adolescents having the condition [30].

Autism in Adulthood Statistics: How Many Adults Have Autism?
About 2.21% of American adults (18 and older) have ASD [11].
Autism affects 5.44 million adults in the country [11].
Autism Statistics: What are the Odds of Having a Child with Autism?
Older parental age at conception (35 and older) has 90% (mother) and 40% (father) higher odds of having a child with ASD [33].
Compared to the general population [1]:
- Mothers who have one or more siblings with autism make them 3 times more likely to have a child with autism.
- Fathers who have one or more siblings with autism make them 2 times more likely to have a child with autism.
3% to 5% of children whose parents have autistic siblings might also have the disorder. Among the general population, the rate is 1.5% [1].
Having one autistic child increases the risk of having another autistic child with the same partner by 10.1% [37].
- Recurrence risk among maternal half-siblings is higher at 4.8%, compared to paternal half-siblings at 2.3%.
- Shorter interbirth interval (18 months or less) increases recurrence risk by 14.4%, compared to longer interbirth interval (four years or more) by 6.8%.
One twin with autism increases the risk of the other twin also having autism by 96% [41].
Autism Demographics: How Common is Autism?
Autism occurs the most among boys at 4.3%, adult males at 3.62%, older children aged 12 to 17 at 3.1%, and White Americans at 3.0%.
The state with the highest autism rate among children is Louisiana at 4.8%. Among adults, the state with the highest autism rate is Massachusetts at 2.42%.
Autism Rates by Gender: Is Autism More Common in Males or Females?
4.3% or 1.3 million male children (3 to 17 years) in the US have autism. Boys make up 79.7% of 1.67 million children with ASD [30].
Girls make up 20.3% of the total ASD cases. The disorder affects 1.1% of their population or 338,595 girls [30].
Autism also occurs more in adult males than females.
3.62% or 4.36 million men in the US have an autism diagnosis. They make up the bulk of autism cases at 80.13% [11].
Women make up 19.87% of cases. ASD affects only 0.86% or 1.08 million of the country’s female population [11].
The Female Protective Effect Theory
Males are 4.2 times more likely to develop autism. And the female protective effect theory may help explain why [25].
One study noted that autistic girls have more first-degree relatives with ASD. Compared to autistic boys with autism, they also have more relatives who manifest autistic characteristics. This suggests that females have a higher tolerance to ASD risks than males. They need to have higher risk factor loads to develop autism [10].
Autistic girls also carry more genetic mutations, including de novo variants. These are mutations not found in either parent and may have happened during fertilization. However, studies found that females are more resistant to these genetic mutations than males [24].
The differences in male and female sex chromosomes may also shed some light on the theory [15].
Females have two X chromosomes. Males, on the other hand, have one X and one Y chromosome. These chromosomes contain a gene called NLGN4. This functions to establish synapses and maintain their integrity. Healthy synapses promote better communication between the neurons.
The NLGN4 gene found in the X chromosome is called NLGN4X and NLGN4Y in the Y chromosome. They’re 97% identical. But of the two NLGN4s, NLGN4X has better abilities to move to the cell’s surface and make synapses than NLGN4Y.
Mutations in the NLGN4 genes disrupt their functions and increase autism risk. Unfortunately, most mutations occur in the NLGN4X gene.
Because females have two X chromosomes, the mutation of one NLGN4X prompts the other NLGN4X to compensate for the deficit.
This same effect doesn't happen in males. When their NLGN4X gene mutates, their NLGN4Y can’t compensate for the loss. This disrupts synaptic signaling, resulting in higher autism risk and more severe symptoms.
These theories may help explain why autism affects more boys than girls.
However, some experts believe that girls with autism are simply underdiagnosed, resulting in a lower autism rate.
Girls with autism may exhibit different symptoms than boys with autism. They display less repetitive and restrictive behaviors. The differences can result in a misdiagnosis, late diagnosis, or underdiagnosis. This then delays treatment or prevents them from getting the right treatment [16].
Autism Rates by Age: Number of People with Autism by Age
Autism affects children aged 12 to 17 the most, with 3.1% of their population having ASD. They make up 46.1% of the total autism cases in the US with 769,833 [30].
The least affected age group is children between 3 and 5 years. Autism affects only 2.3% or 273,013 of their population. They make up 16.3% of the total cases [30].
Among adults, autism affects young adults (18 to 29 years) the most. Of the 255 adults with ASD who participated in a survey, 45.5% or 116 of them have ASD [13].
The disorder affects middle-aged adults the least. Of the 255 adults, only 26.3% or 67 individuals have autism [13].
Average Age of Autism Diagnosis
Most children with autism received their diagnoses between the ages of 3 and 5. 42.2% or 706,283 out of the 1.67 million children with autism received their autism diagnoses between these ages [30].
Autism diagnosis at 5 to 17 years is not as common. Only 28.6% or 479,643 received autism diagnoses between these ages [30].
Autism Rates by Race: What Ethnicity Has the Highest Rate of Autism?
Autism occurs the most among White American children, affecting 3.0% of their population. They make up 53.8% of the total autism cases in the US with 899,041 [30].
ASD affects Asian American children the least. It affects only 1.5% or 42,975 of their population, making up 2.6% of the total ASD cases [30].
Autism Rates by State: States with the Highest Autism Rates
4.8% or 43,042 of Louisiana’s children aged 3 to 17 have autism. It’s the state with the highest autism rate [30].
Pennsylvania ranks second with 4.6% or 99,182 children. New Hampshire and Rhode Island rank third with 4.1% each. This translates to 8,651 children in New Hampshire and 7,045 children in Rhode Island having the disorder [30].
The states with the lowest autism rates are South Dakota (3,121) and Hawaii (4,403) at 1.8%. Washington (26,679) and Utah (14,535) land second place with 1.9% each [30].
The states with the third lowest rates are Tennessee, Nebraska, Missouri, and Iowa. Only 2% of their children have an autism diagnosis [30].
Owing to their large populations, the state with the highest number of ASD cases is Texas with 171,695. It makes up 10.3% of the total cases [30].
California with its 167,489 cases also makes up 10.0% of the total cases [30].
Pennsylvania has the third highest number of ASD cases with 99,182. Florida and New York rank fourth and fifth with 98,268 and 90,250 children, respectively [30].
Massachusetts has the highest adult autism rate. 2.42% or 129,168 adults have an autism diagnosis [11].
Virginia ranks second with 2.41% or 155,557 Virginians having ASD. At 2.37%, Connecticut lands third place. 65,337 of its residents have autism [[11].
The state with the lowest adult autism rate is Louisiana at 1.97% or 68,819 adults. South Carolina ranks second. 1.98% or 75,985 adults deal with ASD [11].
The states with the third lowest adult autism rates are North Carolina and New Mexico. ASD affects 2% of their populations. This translates to 155,953 North Carolinians and 31,207 New Mexicans [11].
Owing to its large population, California has the highest number of autism cases. The state makes up 12.9% of the total adult autism cases with 701,669. This is 2.36% of its adult population [11].
The state with the second highest number of autism cases is Texas at 2.19% or 449,631 Texans. They make up 8.3% of the total cases [11].
New York ranks third at 2.25% or 342,280 autism cases. The state makes up 6.3% of the total autism cases [11].
Best and Worst States to Live with Autism
According to Stanford researchers, Montana is the best state to live with autism, with a resource load of 1 [31]. Resource load estimates a state’s supply of autism resources over demand or population. The lower the value, the better the state can meet the resource demand.
Connecticut ranks second with 1.09, followed by Colorado and Rhode Island with 1.1 each. These states have the lowest resource loads and high autism support [31].
West Virginia, on the other hand, is the worst state to live with autism. It has the highest resource load of 5.71. Kentucky ranks the second worst state to raise a child with autism with 4.26. Maine ranks third with 4.15 [31].
The shorter the distance of the patient from the resource, the sooner the patient can receive proper diagnosis and treatment. New Jersey ranks first, with only 2.32 mi (3.74 km) between patient and resource. Connecticut follows with 2.90 mi (4.67 km) and Maryland with 3.51 mi (5.65 km) [31].
Alaska has the greatest average distance between individuals with autism and autism resources with 62.55 mi (100.66 km). Nevada and Wyoming follow in second and third places with 33.65 mi (54.16 km) and 33.64 mi (54.14 km), respectively [31].
Using the GapMap database, researchers at Stanford University measured the autism resource load of each state in 2019. GapMap identifies the states’ autism resources and analyzes the geographical gaps in access to these resources.
The researchers found about 28,003 resources in the country and assigned them into seven categories.
- Therapy
- Support
- Health
- Education
- Recreation
- Diagnosis
- Others
Of the seven categories, diagnosis resources accounted for only 8.83% of all autism resources. They also noted that 83.86% or 2,635 out of the 3,142 US counties don’t have sufficient diagnostic resources [31].
We also don’t have enough qualified and certified autism specialists who can properly diagnose autism. Based on estimates, we only have about 1,000 developmental-behavioral pediatricians and 1,500 pediatric neurologists. The country’s pediatric psychiatrists are only about 8,300 [31].
The lack of diagnostic resources increases a state’s resource load. This makes it harder for people with autism to get a proper diagnosis and receive appropriate treatment [31].
The distance between patient and resource contributes to lengthy waitlists. Not only does this delay autism diagnosis but also delay treatment.
The average distance between a person living with autism and any autism resource or category is about 10.64 mi (17.12 km). However, when you break them down per category, diagnosis is the farthest resource at 22.05 mi (35.49 km). This lowers autism support even further and worsens diagnostic bottleneck [31].
The states with the highest resource loads and greatest average distance to autism resources are mostly rural states.
42% of families in lower socioeconomic groups and living in a rural state have to go to another city to get an autism diagnosis [31].
63% of the families only receive an autism diagnosis for their child after the third doctor’s visit [31].
Urban states, on the other hand, have higher chances of early detection and early intervention.
The study’s findings may help explain the disparities in the autism rates of the different states.
Note: The study uses simulated population density and autism population.
Autism Rates Over Time: Is Autism Increasing?
There had been a 170% increase in the country’s autism rate from 2007’s 1% to 2020’s 2.7%. Data came from the National Survey of Children's Health (NSCH) [30].
In 2007, autism affected 1% of the children’s population (3 to 17 years). This translates to 1 in 100 or 10.5 per 1,000 children [30].
The autism rate nearly doubled in just four years. By 2011, 1.8% of children now had autism, the disorder affecting 1 in 55 children [30].
Between 2011 and 2016, the rate increased further by 38.9%, affecting 2.5% or 1 in 40 children [30].
2018 saw a 9.7% decrease in the autism rate from 2017. From 2017’s 3.1% (1 in 32 children), it dropped to 2.8% (1 in 36 children) [30].
An uptick was noted in 2019 at 3.1% before dropping to 2.7% in 2020. Current data from NSCH shows that autism affected 1 in 37 children in 2020 [30].
By 2025, 1 in 2 children will have received an autism diagnosis — or so a senior research scientist at MIT claimed in 2014 [40].
According to Stephanie Seneff, PhD, glyphosate toxicity causes the skyrocketing rate of autism. She noted in a panel discussion that autism symptoms mimic glyphosate toxicity. Seneff also showed the correlation between the increasing use of glyphosate (a popular herbicide) and the increasing autism rate [40].
So, Will 50% of Children be Autistic by 2025?
No, 50% of the country’s children won't be autistic by 2025. And experts have debunked some of the popular theories as to why autism is increasing.
Glyphosate has been implicated in the increasing autism rate. According to the FDA, nearly 99% of the samples tested for pesticide residues have values lower than the levels set by the Environmental Protection Agency (EPA). This means we can safely eat the fruits and veggies we buy on the market [12].
Older parental age increases autism risk in the offspring. However, only 2.7% of the increase in ASD cases are attributable to older parental age [33].
Vaccines (particularly MMR) have also been blamed for the increase in autism rate. However, several studies have already refuted this theory [27]. Not getting vaccinated increases the risk of exposure to 18 deadly but preventable diseases [34].
Why is Autism Increasing Then?
200% of the increase in autism rate come from changes in diagnostic criteria and reporting practices. The inclusion of some developmental delay and milder ASD cases also contributed to the spike [36].
9% of ASD cases come from overdiagnosis. The symptoms of other developmental disabilities look similar to autism. These include ADHD, cerebral palsy, and learning disabilities. It’s possible children with these neurodevelopmental problems also received ASD diagnosis [14].
Over 10% of children received an ASD diagnosis despite inconclusive evaluation. The data came from a survey of pediatric physicians and neurologists. 52.8% of them said ASD diagnosis was given despite clinical ambiguity [9].
Autism rates have indeed increased over the years. However, the factors mentioned above may have contributed the most to the increase.
Mortality in People with Autism Spectrum Disorder
In a study of 1,367 deaths involving people with autism, deadly injuries made up 27.87% (381) of the total deaths [17].
- Of the 27.87%, suffocation made up 23.62% (90). It’s the leading cause of accidental death among people with ASD.
- The two other top causes of death include asphyxiation at 20.47% (78) and drowning at 19.42% (74).
Accidental drowning makes up about 90% of deaths among children 14 years old and younger with autism who wandered away from their caregivers[44].
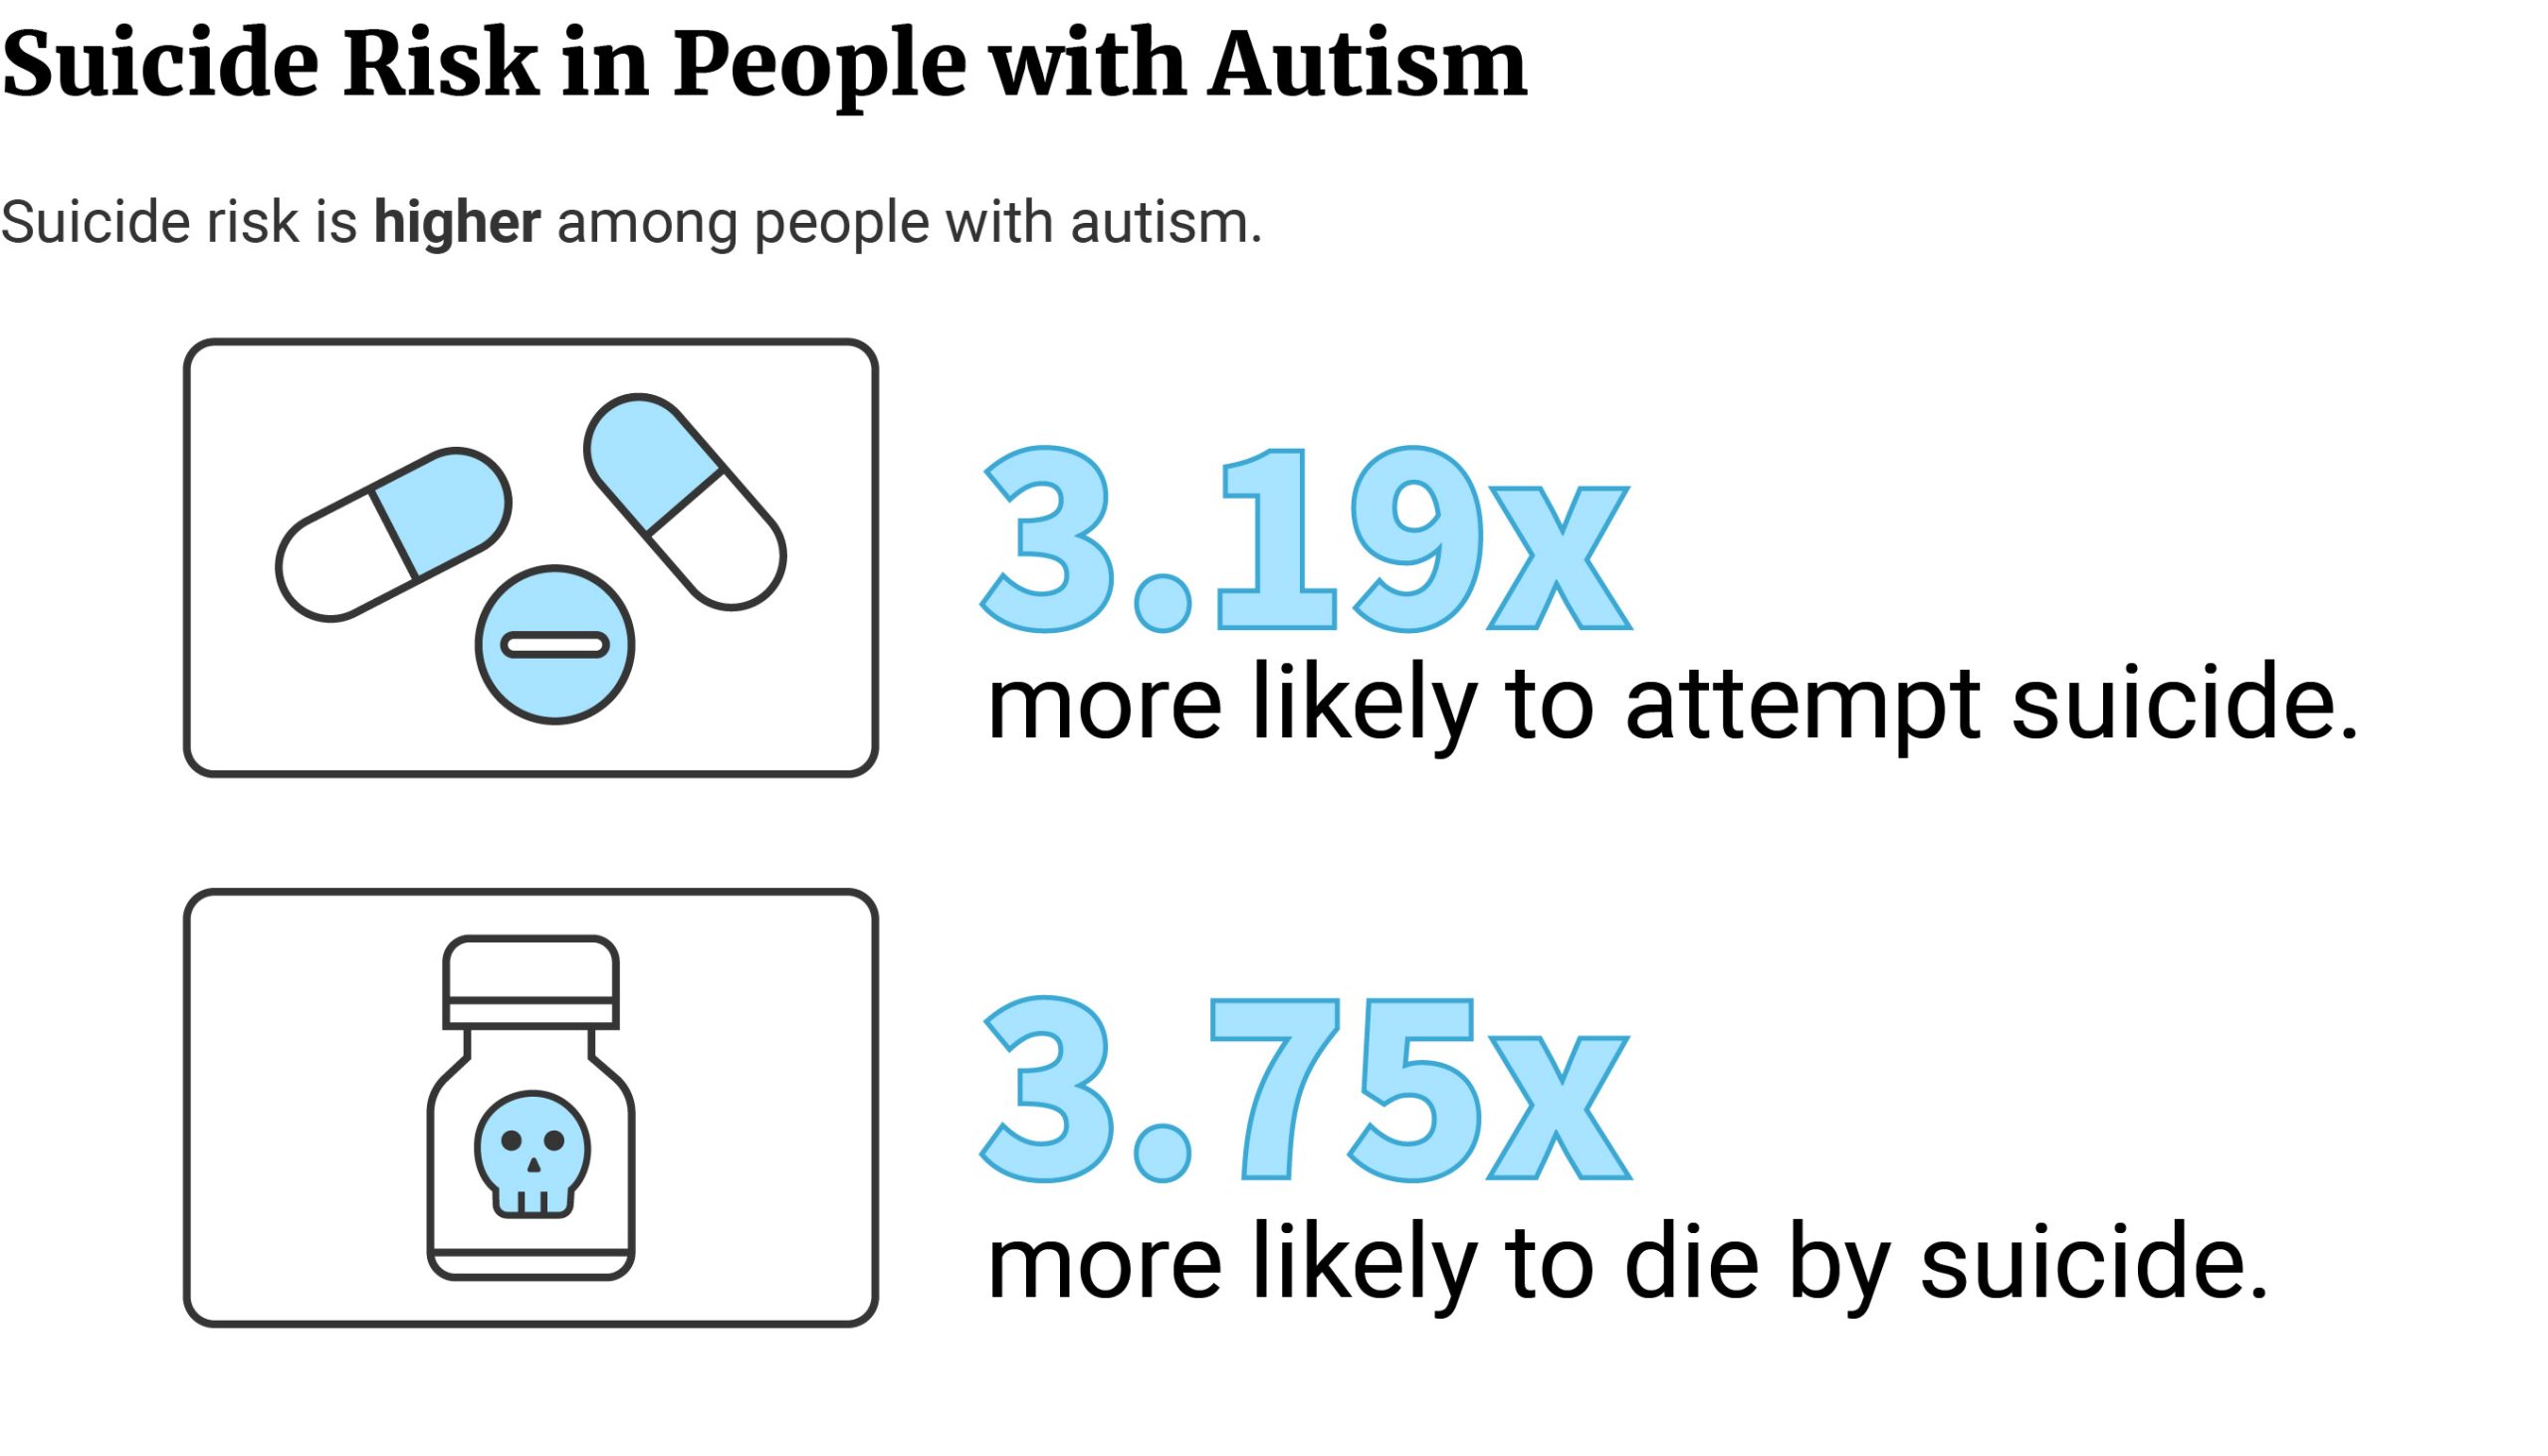
Autism Spectrum Disorder and Suicide Risks
People with autism are 3.19 times more likely to attempt suicide and 3.75 times more likely to die by suicide [22].

Females with autism are 4.41 times more likely to attempt suicide than males with autism [22].
Compared to people without autism, males and females with autism are 3.48 and 2.36 times more likely to die by suicide, respectively [22].
Compared to people without mental health issues, people with autism and comorbid mental illness are 9.27 times more likely to attempt suicide. People with autism diagnosis only are 1.33 times more likely to attempt suicide than people without mental illness [22].
Economic Costs of Autism
One study estimated autism cost the US $223 billion in 2020, with the cost ranging between $175 and $271 billion [5].
By 2025, autism will have increased by 65.92% in just five years to $370 billion. The autism cost can range anywhere from $290 million to $450 million [5].
From 2020 to 2030, autism costs will nearly triple to $589, increasing by 164.13%. Their estimates also see autism costs soaring to $1.36 trillion in 2040 and $5.54 trillion in 2060 [5].
The CDC, on the other hand, shows a higher autism cost estimate for 2025 at $461 billion [23].
With preventive measures, this can drop to as low as $276 billion. However, should the ASD prevalence rate remain constant, it can soar to as high as $1 trillion [23].
Average Cost of Autism Per Individual
Caring for a child with autism costs $4,110 to $6,200 more than a child without the disorder yearly [42].
Caregivers also have to shell out $40,000 to $60,000 per autistic child per year for intensive behavioral therapy [43].
Autism Treatment: Behavioral Therapy and Medications for Autism
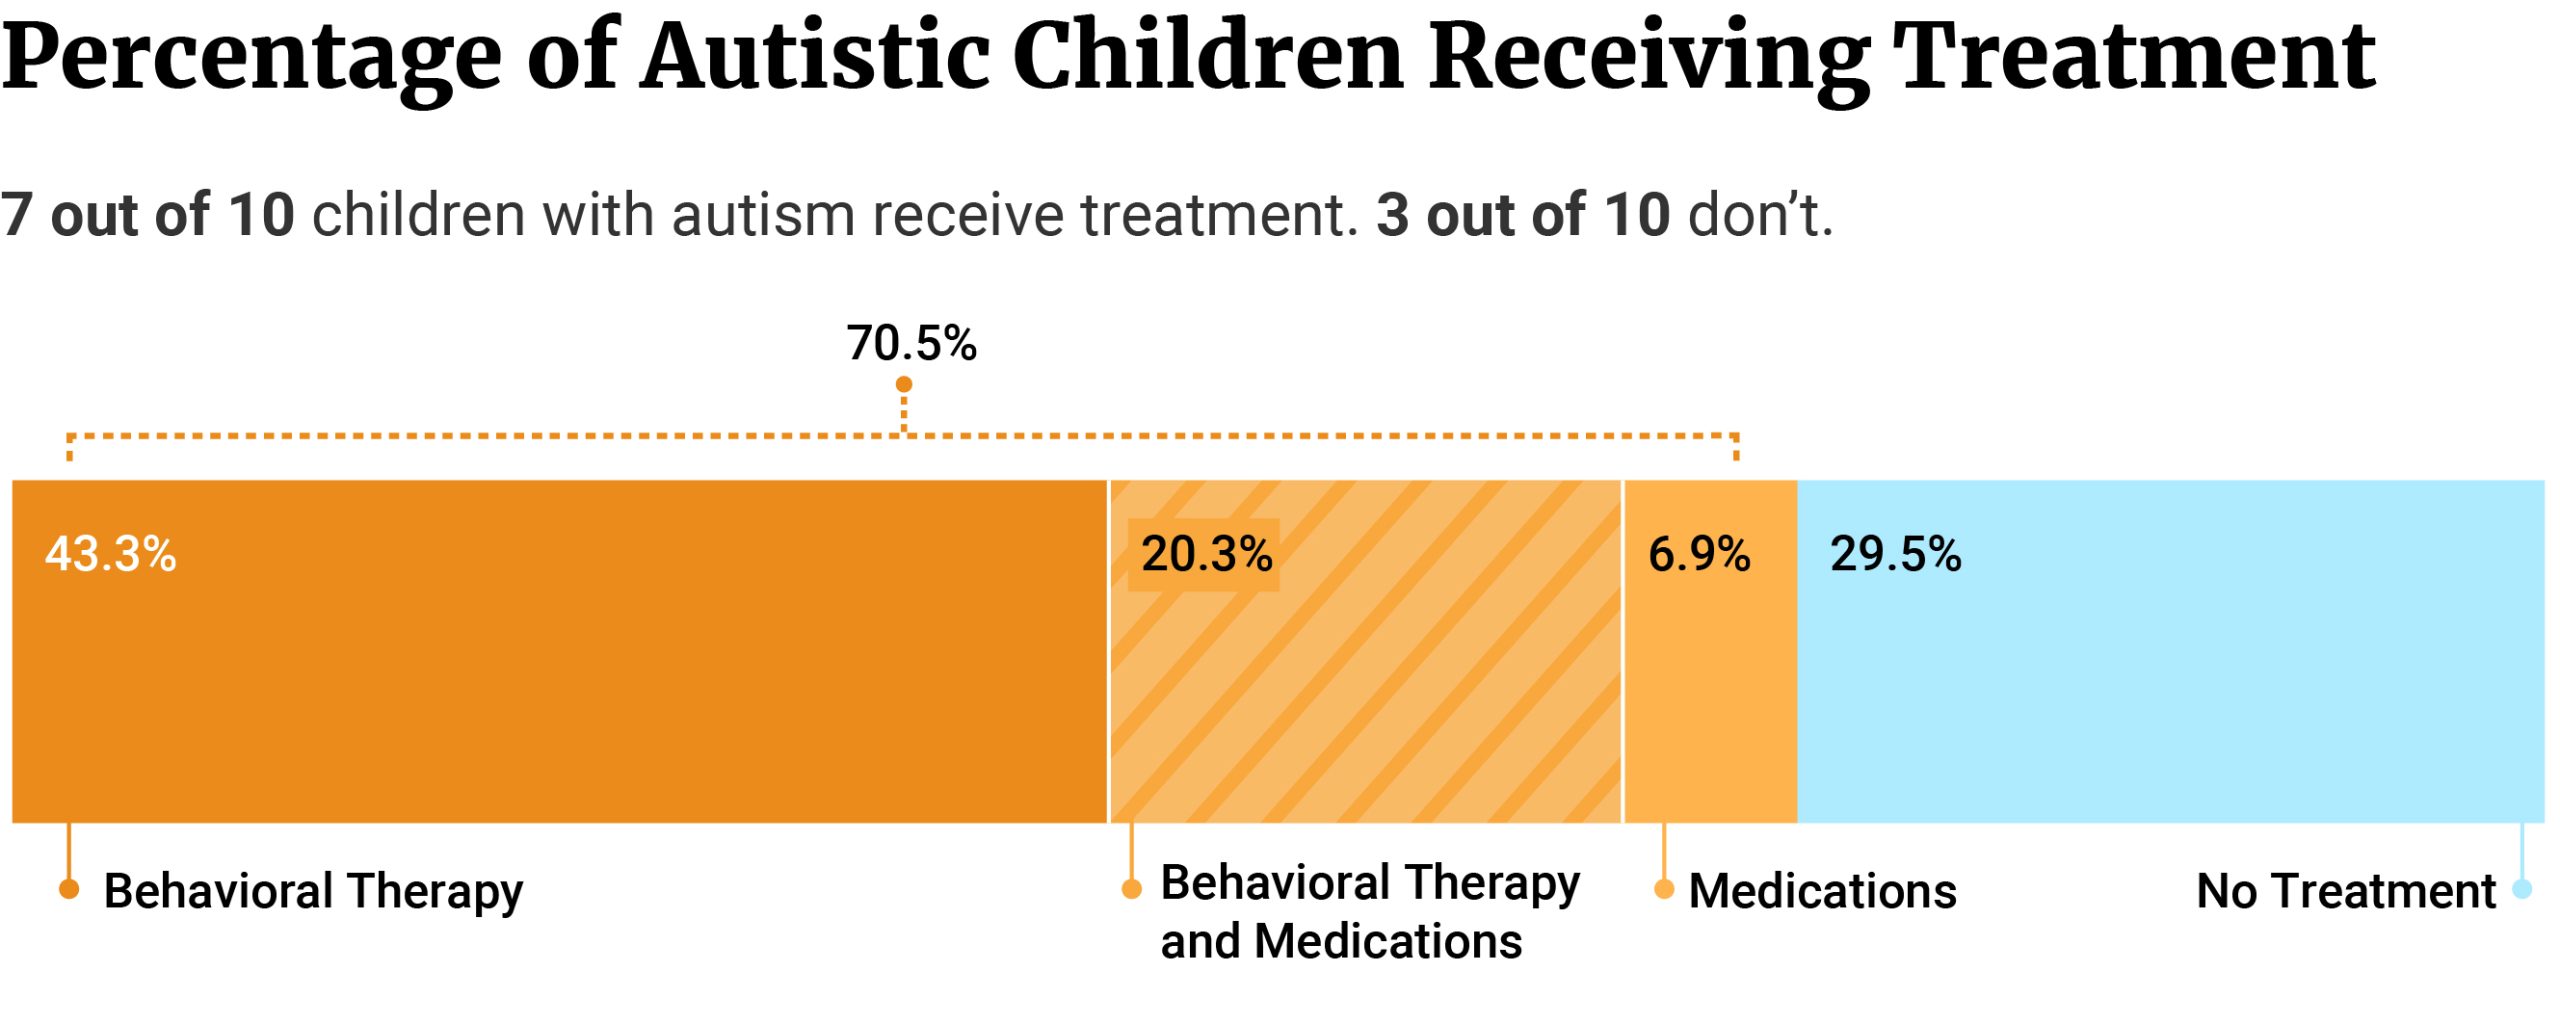
70.5% of children (3 to 17 years) with autism receive treatment [47].
43.3% of them receive behavioral treatment only. 6.9% of them receive medications only [47].
20.3% receive both behavioral treatment and medications [47].
29.5% of children with autism have not received any treatment [47]. They don’t take any medications or go to behavioral therapy.

70.4% of those who don’t receive any treatment don’t have insurance[47].
Only 19.1% of uninsured children with autism receive behavioral therapy. 13.2% of them receive medications for autism [47].
56% of children with ASD have taken at least one psychotropic drug or medication [26].
31% have taken neuroleptic drugs. These antipsychotic drugs help calm the patient by blocking dopamine receptors[26].
25% have taken antidepressants, while 22% have taken stimulants [26].
Autism Treatment by Age
Behavioral treatment is highest among younger children (3 to 5 years). 74.1% of them receive behavioral therapy, compared to 68.9% of children aged 6 to 11 and 54.4% of children aged 12 to 17 [47].
Medication use, on the other hand, is highest among older children (12 to 17 years).
32.8% of them use medications, compared to 28.5% of children aged 6 to 11 and 8.4% of younger children aged 3 to 5 [47].
Of those who don’t receive autism treatment, 34.6% of them are older children aged 12 to 17 years. Children aged 6 to 11 make up 26.2% of those who don’t receive any autism treatment. Younger children aged 3 to 5 make up 24.9% [47].
Autism Treatment by Gender
66.6% of girls with autism receive behavioral therapy. 62.8% of boys with ASD also receive behavioral therapy [47].
More boys with autism take medications for ASD at 30.0%, compared to girls with ASD at 16.8% [47].
More girls with autism don’t receive treatment at 30.1%, compared to 29.4% of boys with autism [47].
Complementary Alternative Treatment for Autism
28% to as high as 74% of children with autism have received at least one or more complementary alternative treatments (CAM) [21].
In a survey of 194 parents, 80.9% said they tried complementary alternative treatment (CAM) for their children with autism [19].
Of the different CAM products and therapies, 58.6% have tried multivitamins [19].
The second most popular CAM method is diet. 54.8% of parents placed their children on a gluten-free, casein-free diet [19].
54.1% gave methyl B-12 injections to the child, and 52.2% gave their child probiotics [19].
Supplements containing fish oil and essential fatty acids are also popular. 51.6% of parents gave such supplements to their children [19].
The least popular CAM methods are [19]:
- Homeopathy: 8.3%
- Oral anti-inflammatories: 12.7%
- Curcumin: 14.0%
- Oxytocin nasal spray: 14.0%
- Grapefruit seed extract: 15.3%
Based on a scale of 1 to 5 (with 5 being the most effective), parents gave sensory integration therapy the highest rating at 4.52. 43.3% of the parents say their children undergo sensory integration therapy [19].
Melatonin is the second most effective CAM method with 4.50. Off-label use of antifungal medications follows with 4.41 [19].
Homeopathy and probiotics received 4.29 and 4.26 ratings, respectively [19].
The least effective CAM product is curcumin with 3.54 [19].
Multivitamins, which nearly 3 in 5 parents use, are the second least effective CAM product. Parents gave it a rating of 3.68 [19].
Oxytocin nasal spray (3.76), Epsom salt baths (3.81), and chelation-DMSA (3.94) also received the lowest ratings [19].
Another popular complementary treatment for autism is CBD.
A study followed 53 children with autism who received oral CBD for 66 days [3].
74.5% of parents reported an overall improvement in symptoms. Only 3.9% said the symptoms worsened [3].
CBD helped with sleep problems the most. 71.4% of the parents reported sleep improvement, compared to 4.7% who said sleep worsened [3].
CBD also helped with hyperactivity symptoms. 68.4% of them said it helped reduce hyperactivity symptoms. 2.6% say CBD worsened the symptom [3].
Parents also noted an improvement in self-injury symptoms and rage attacks. 67.6% said CBD helped control these symptoms, compared to 8.8% who say these symptoms worsened [3].
CBD helped with anxiety the least. Only 47.1% said CBD reduced anxiety, while 23.5% say it worsened the symptom [3].
Final Thoughts
1 in 37 children and 1 in 45 adults in the US have autism. This translates to about 2.7% (1.67 million) and 2.21% (5.44 million) of their populations, respectively. It affects males the most, compared to females.
Autism has no single causative factor, but many factors can increase autism risk. These include genes, exposure to toxins, older parental age, and pregnancy-related complications.
Autism also has no known cure, but medications help control symptoms. Behavioral therapy teaches them how to control undesired behaviors and negative emotions. It also encourages positive behavior and teaches them new skills.
If you suspect your child may be autistic or have a developmental disability, please see their pediatrician for proper diagnosis and treatment.
You may also get in touch with the following organizations for additional information and support:
- Autism Society: autismsociety.org and 1 (800) 328-8476
- Autism Speaks: autismspeaks.org and (888) 288-4762
References
- Autism risk estimated at 3 to 5% for children whose parents have a sibling with autism. (2020). National Institutes of Health (NIH). [1]
- Banks. (2020). How to define verbal ability in autistic children. Autism Research News. [2]
- Barchel, D., Stolar, O., De-Haan, T., Ziv-Baran, T., Saban, N., Fuchs, D. O., Koren, G., & Berkovitch, M. (2019). Oral Cannabidiol Use in Children With Autism Spectrum Disorder to Treat Related Symptoms and Co-morbidities. Frontiers in Pharmacology, 9. [3]
- Blanchard, A., Chihuri, S., DiGuiseppi, C. G., & Li, G. (2021). Risk of Self-harm in Children and Adults With Autism Spectrum Disorder. JAMA Network Open, 4(10), e2130272. [4]
- Blaxill, M., Rogers, T., & Nevison, C. (2021). Autism Tsunami: the Impact of Rising Prevalence on the Societal Cost of Autism in the United States. Journal of Autism and Developmental Disorders, 52(6), 2627–2643. [5]
- Bradshaw, P., Pickett, C., van Driel, M. L., Brooker, K., & Urbanowicz, A. (2021). ‘Autistic’ or ‘with autism’? Why the way general practitioners view and talk about autism matters. Australian Journal of General Practice, 50(3), 104–108. [6]
- Chaste, P., & Leboyer, M. (2012). Autism risk factors: genes, environment, and gene-environment interactions. Dialogues in Clinical Neuroscience, 14(3), 219–351. [7]
- Child Intelligence Measures. (2018). University of Basrah. [8]
- Davidovitch, M., Shmueli, D., Rotem, R. S., & Bloch, A. M. (2021). Diagnosis despite clinical ambiguity: physicians’ perspectives on the rise in Autism Spectrum disorder incidence. BMC Psychiatry, 21(1). [9]
- Desachy, G., Croen, L. A., Torres, A. R., Kharrazi, M., Delorenze, G. N., Windham, G. C., Yoshida, C. K., & Weiss, L. A. (2015). Increased female autosomal burden of rare copy number variants in human populations and in autism families. Molecular Psychiatry, 20(2), 170–175. [10]
- Dietz, P. M., Rose, C. E., McArthur, D., & Maenner, M. (2020). National and State Estimates of Adults with Autism Spectrum Disorder. Journal of Autism and Developmental Disorders, 50(12), 4258–4266. [11]
- Eat with Confidence. (2021). U.S. Department of Agriculture (USDA). [12]
- Fortuna, R. J., Robinson, L., Smith, T. H., Meccarello, J., Bullen, B., Nobis, K., & Davidson, P. W. (2015). Health Conditions and Functional Status in Adults with Autism: A Cross-Sectional Evaluation. Journal of General Internal Medicine, 31(1), 77–84. [13]
- Fox, M. (2015). Study Suggests Autism Is Being Overdiagnosed. NBC News. [14]
- Gene linked to sex differences in autism. (2020). National Institutes of Health (NIH). [15]
- Girls and boys with autism differ in behavior, brain structure. (2015). Stanford Medicine. [16]
- Guan, J., & Li, G. (2017). Injury Mortality in Individuals With Autism. American Journal of Public Health, 107(5), 791–793. [17]
- Harker, C. M., & Stone, W. L. (2014). Comparison of the Diagnostic Criteria for Autism Spectrum Disorder Across DSM-5, DSM-IV-TR, and the Individuals with Disabilities Education Act (IDEA). Vanderbilt Peabody College. [18]
- Hopf, K. P., Madren, E., & Santianni, K. A. (2016). Use and Perceived Effectiveness of Complementary and Alternative Medicine to Treat and Manage the Symptoms of Autism in Children: A Survey of Parents in a Community Population. The Journal of Alternative and Complementary Medicine, 22(1), 25–32. [19]
- Hwang, S., Kim, Y. S., Koh, Y. J., & Leventhal, B. L. (2017). Autism Spectrum Disorder and School Bullying: Who is the Victim? Who is the Perpetrator? Journal of Autism and Developmental Disorders, 48(1), 225–238. [20]
- Hyman, S. L., Levy, S. E., Myers, S. M., Kuo, D. Z., Apkon, S., Davidson, L. F., Ellerbeck, K. A., Foster, J. E., Noritz, G. H., Leppert, M. O., Saunders, B. S., Stille, C., Yin, L., Weitzman, C. C., Childers, D. O., Levine, J. M., Peralta-Carcelen, A. M., Poon, J. K., Smith, P. J., . . . Bridgemohan, C. (2020). Identification, Evaluation, and Management of Children With Autism Spectrum Disorder. Pediatrics, 145(1). [21]
- Kõlves, K., Fitzgerald, C., Nordentoft, M., Wood, S. J., & Erlangsen, A. (2021). Assessment of Suicidal Behaviors Among Individuals With Autism Spectrum Disorder in Denmark. JAMA Network Open, 4(1), e2033565. [22]
- Leigh, J. P., & Du, J. (2015). Brief Report: Forecasting the Economic Burden of Autism in 2015 and 2025 in the United States. Journal of Autism and Developmental Disorders, 45(12), 4135–4139. [23]
- Levy, D., Ronemus, M., Yamrom, B., Lee, Y. H., Leotta, A., Kendall, J., Marks, S., Lakshmi, B., Pai, D., Ye, K., Buja, A., Krieger, A., Yoon, S., Troge, J., Rodgers, L., Iossifov, I., & Wigler, M. (2011). Rare De Novo and Transmitted Copy-Number Variation in Autistic Spectrum Disorders. Neuron, 70(5), 886–897. [24]
- Maenner, M. J., Shaw, K. A., Bakian, A. V., Bilder, D. A., Durkin, M. S., Esler, A., Furnier, S. M., Hallas, L., Hall-Lande, J., Hudson, A., Hughes, M. M., Patrick, M., Pierce, K., Poynter, J. N., Salinas, A., Shenouda, J., Vehorn, A., Warren, Z., Constantino, J. N., . . . Cogswell, M. E. (2021). Prevalence and Characteristics of Autism Spectrum Disorder Among Children Aged 8 Years — Autism and Developmental Disabilities Monitoring Network, 11 Sites, United States, 2018. MMWR. Surveillance Summaries, 70(11), 1–16. [25]
- Mandell, D. S., Morales, K. H., Marcus, S. C., Stahmer, A. C., Doshi, J., & Polsky, D. E. (2008). Psychotropic Medication Use Among Medicaid-Enrolled Children With Autism Spectrum Disorders. Pediatrics, 121(3), e441–e448. [26]
- MMR Vaccine Does Not Cause Autism. (2004). Immunize. [27]
- Modabbernia, A., Velthorst, E., & Reichenberg, A. (2017). Environmental risk factors for autism: an evidence-based review of systematic reviews and meta-analyses. Molecular Autism, 8, 13. [28]
- Mosner, M. G., Kinard, J. L., Shah, J. S., McWeeny, S., Greene, R. K., Lowery, S. C., Mazefsky, C. A., & Dichter, G. S. (2019). Rates of Co-occurring Psychiatric Disorders in Autism Spectrum Disorder Using the Mini International Neuropsychiatric Interview. Journal of Autism and Developmental Disorders, 49(9), 3819–3832. [29]
- National Survey of Children’s Health (NSCH) Interactive Data Query. (2021). Health Resources & Services Administration. [30]
- Ning, M., Daniels, J., Schwartz, J., Dunlap, K., Washington, P., Kalantarian, H., Du, M., & Wall, D. P. (2019). Identification and Quantification of Gaps in Access to Autism Resources in the United States: An Infodemiological Study. Journal of Medical Internet Research, 21(7), e13094. [31]
- Oberman, L. M., & Kaufmann, W. E. (2020). Autism Spectrum Disorder Versus Autism Spectrum Disorders: Terminology, Concepts, and Clinical Practice. Frontiers in Psychiatry, 11. [32]
- Quinlan, C. A., McVeigh, K. H., Driver, C. R., Govind, P., & Karpati, A. (2015). Parental Age and Autism Spectrum Disorders Among New York City Children 0–36 Months of Age. Maternal and Child Health Journal, 19(8), 1783–1790. [33]
- Recommended Vaccines by Disease. (2016). Centers for Disease Control and Prevention. [34]
- Rett Syndrome Fact Sheet. (2022). National Institute of Neurological Disorders and Stroke. [35]
- Rice, C. E., Rosanoff, M., Dawson, G., Durkin, M. S., Croen, L. A., Singer, A., & Yeargin-Allsopp, M. (2012). Evaluating Changes in the Prevalence of the Autism Spectrum Disorders (ASDs). Public Health Reviews, 34(2). [36]
- Risch, N., Hoffmann, T. J., Anderson, M., Croen, L. A., Grether, J. K., & Windham, G. C. (2014). Familial Recurrence of Autism Spectrum Disorder: Evaluating Genetic and Environmental Contributions. American Journal of Psychiatry, 171(11), 1206–1213. [37]
- Rose, V., Trembath, D., Keen, D., & Paynter, J. (2016). The proportion of minimally verbal children with autism spectrum disorder in a community-based early intervention programme. Journal of Intellectual Disability Research, 60(5), 464–477. [38]
- Rylaarsdam, L., & Guemez-Gamboa, A. (2019). Genetic Causes and Modifiers of Autism Spectrum Disorder. Frontiers in Cellular Neuroscience, 13. [39]
- Scientist argues that “glyphosate” will lead to autism in 50% of children by 2025. (2015). Friends of the MST. [40]
- Severity of autism symptoms varies greatly among identical twins. (2019). National Institutes of Health (NIH). [41]
- Shimabukuro, T. T., Grosse, S. D., & Rice, C. (2007). Medical Expenditures for Children with an Autism Spectrum Disorder in a Privately Insured Population. Journal of Autism and Developmental Disorders, 38(3), 546–552. [42]
- Understanding Autism Spectrum Disorders. (2013). Centers for Disease Control and Prevention. [43]
- University of the Sciences. (2014). Drowning remains a top cause of death for children with autism. ScienceDaily. [44]
- Wan, C. Y., Bazen, L., Baars, R., Libenson, A., Zipse, L., Zuk, J., Norton, A., & Schlaug, G. (2011). Auditory-Motor Mapping Training as an Intervention to Facilitate Speech Output in Non-Verbal Children with Autism: A Proof of Concept Study. PLoS ONE, 6(9), e25505. [45]
- Wiggins, L. D., Durkin, M., Esler, A., Lee, L., Zahorodny, W., Rice, C., Yeargin-Allsopp, M., Dowling, N. F., Hall-Lande, J., Morrier, M. J., Christensen, D., Shenouda, J., & Baio, J. (2019). Disparities in Documented Diagnoses of Autism Spectrum Disorder Based on Demographic, Individual, and Service Factors. Autism Research, 13(3), 464–473. [46]
- Xu, G., Strathearn, L., Liu, B., O’Brien, M., Kopelman, T. G., Zhu, J., Snetselaar, L. G., & Bao, W. (2019). Prevalence and Treatment Patterns of Autism Spectrum Disorder in the United States, 2016. JAMA Pediatrics, 173(2), 153. [47]
