
STD Statistics: States Hit the Hardest by STDs

Report Highlights:
- 8 Southern states landed in the top 10 states with the highest overall STD rates.
- Southern states dominate the top 10 lists of states with the highest chlamydia (7 states), gonorrhea (7 states), syphilis (5 states), and HIV (9 states) rates [4,9-11].
- Chlamydia, gonorrhea, and HIV rates are highest in the South [4,9-10].
- The South has the second-highest syphilis rate, with the West topping the list .
- The Southern states made up 42.5% (1.03 million) of the 2.42 million new cases of reportable STDs in 2020 [4,9-11].
- Mississippi has the worst STD infections, ranking first in the overall STD rate with 1,353.9 per 100,000 people.
- Mississippi has the highest chlamydia and gonorrhea rates (4.5 and 20.8 times higher than Vermont’s).
- Nevada has the highest syphilis rate, affecting 72 per 100k people. Mississippi lands second place with 71.6 per 100k (19.4 times higher than Vermont) [11].
- The HIV rate is highest in Georgia at 18.5 per 100k, which is 14.2 times higher than Maine and Montana (the lowest rate at 1.3) [4].
- Vermont has the lowest chlamydia, gonorrhea, and syphilis rates. The state ranked third to Maine and Montana in the states with the lowest HIV rate [4,9-11].
- The South has the greatest need for HIV pre-exposure prophylaxis (PreP) services. But it has the lowest PreP-to-need rate of 4.4 providers per 100 people needing PreP services [12].
The Southern states have the highest rates of sexually transmitted diseases (STDs). Data came from the Centers for Disease Control and Prevention 2020 STD report.
Eight out of the top 10 states with the highest overall reportable STD rates come from the South. These four reportable STDs include chlamydia, gonorrhea, syphilis, and HIV. Except for syphilis, the South ranks first in the three reportable STDs.
Of the 16 Southern states, Louisiana and Mississippi consistently landed spots in all four reportable STD lists. Alabama, Georgia, North Carolina, and South Carolina were in three. Florida, Tennessee, and Texas got into two STD top state lists.
So, why are STDs hitting Southern states the most?
In this report, we’ll look at the STD rates by state and see where they’re highest. Let’s also explore some factors that may have contributed to the disparities.
COVID-19 Pandemic Caused an “Artificial” Drop in Sexually Transmitted Diseases
The US recorded about 2.42 million new cases of chlamydia, gonorrhea, syphilis, and HIV in 2020. It’s a 6.5% decrease from 2019’s 2.59 million new cases, with chlamydia contributing the most to the decrease in new cases [4,9-11].
However, the COVID-19 pandemic has more to do with the drop in new cases. It’s not really because the rate of STD infections or transmission decreased.
The lockdowns and shelter-in-place orders prevented people from moving around. This, unsurprisingly, slowed down disease transmission, causing an artificial drop in STD rates.
The pandemic also limited in-person visits to healthcare clinics and STD clinical services. This decreased STD screenings and resulted in the underdiagnosis of new STDs. It also prevented people from getting treatment.
As the shelter-in-place orders eased and movement returned to normal, the STD cases began increasing again.
Of the four reportable STDs included in this report, chlamydia and HIV infections decreased in both rate and prevalence as 2020 ended.
The country recorded 1.58 million new chlamydia cases in 2020. It’s 12.7% lower than 2019’s 1.81 million. The rate decreased from 551 per 100,00 in 2019 to 481.3 per 100,000 in 2020 [9].
The number of new HIV cases also decreased by 16.9% — from 36,585 in 2019 to 30,403 in 2020. The rate also dropped from 11.1 to 9.2 per 100,000 people [4].
Gonorrhea and syphilis increased in rate and prevalence during the same period.
Eight Southern States Have the Highest Overall Reportable STD Rates
Eight of the top 10 states with the highest overall reportable STD rates come from the South. Two states came from the West.
Of the 10 states, Mississippi ranks first with 1,353.9 per 100,000 people.
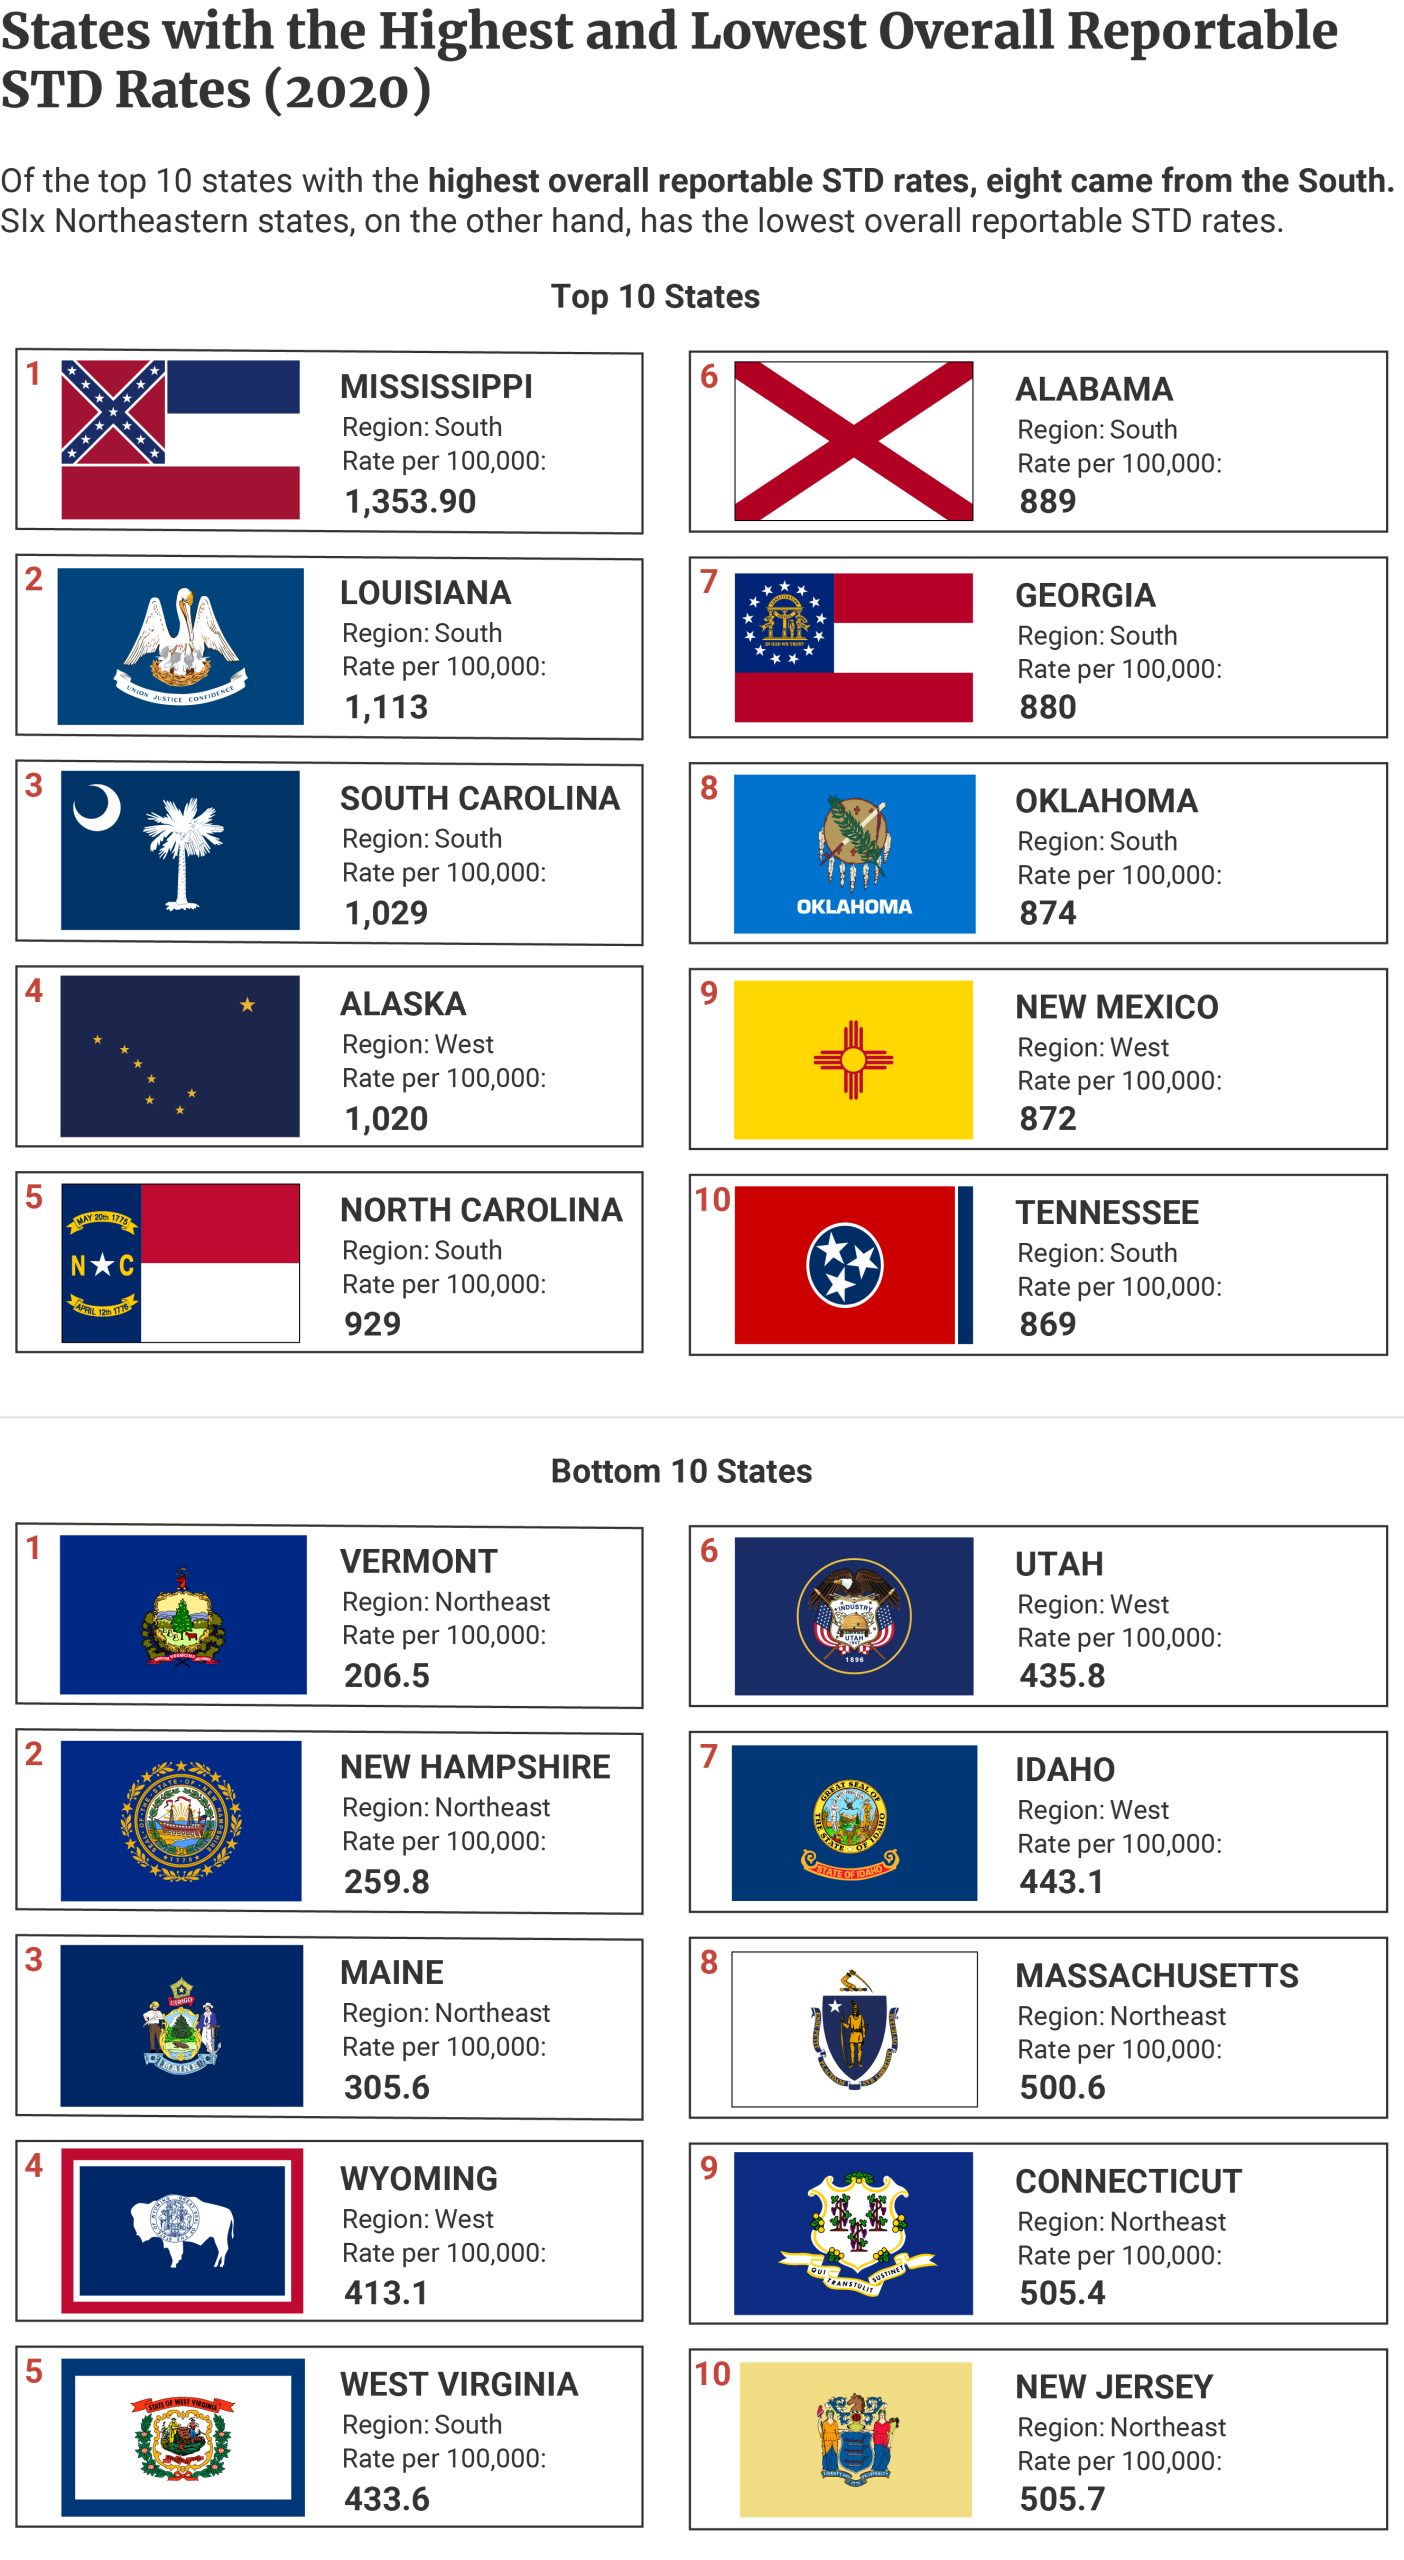

Six states with the lowest overall reportable STD rates come from the Northeast Region. Vermont ranks first with 206.5 per 100,000 people.
West Virginia is the only Southern state that got into the list of states with the lowest overall STD infections.
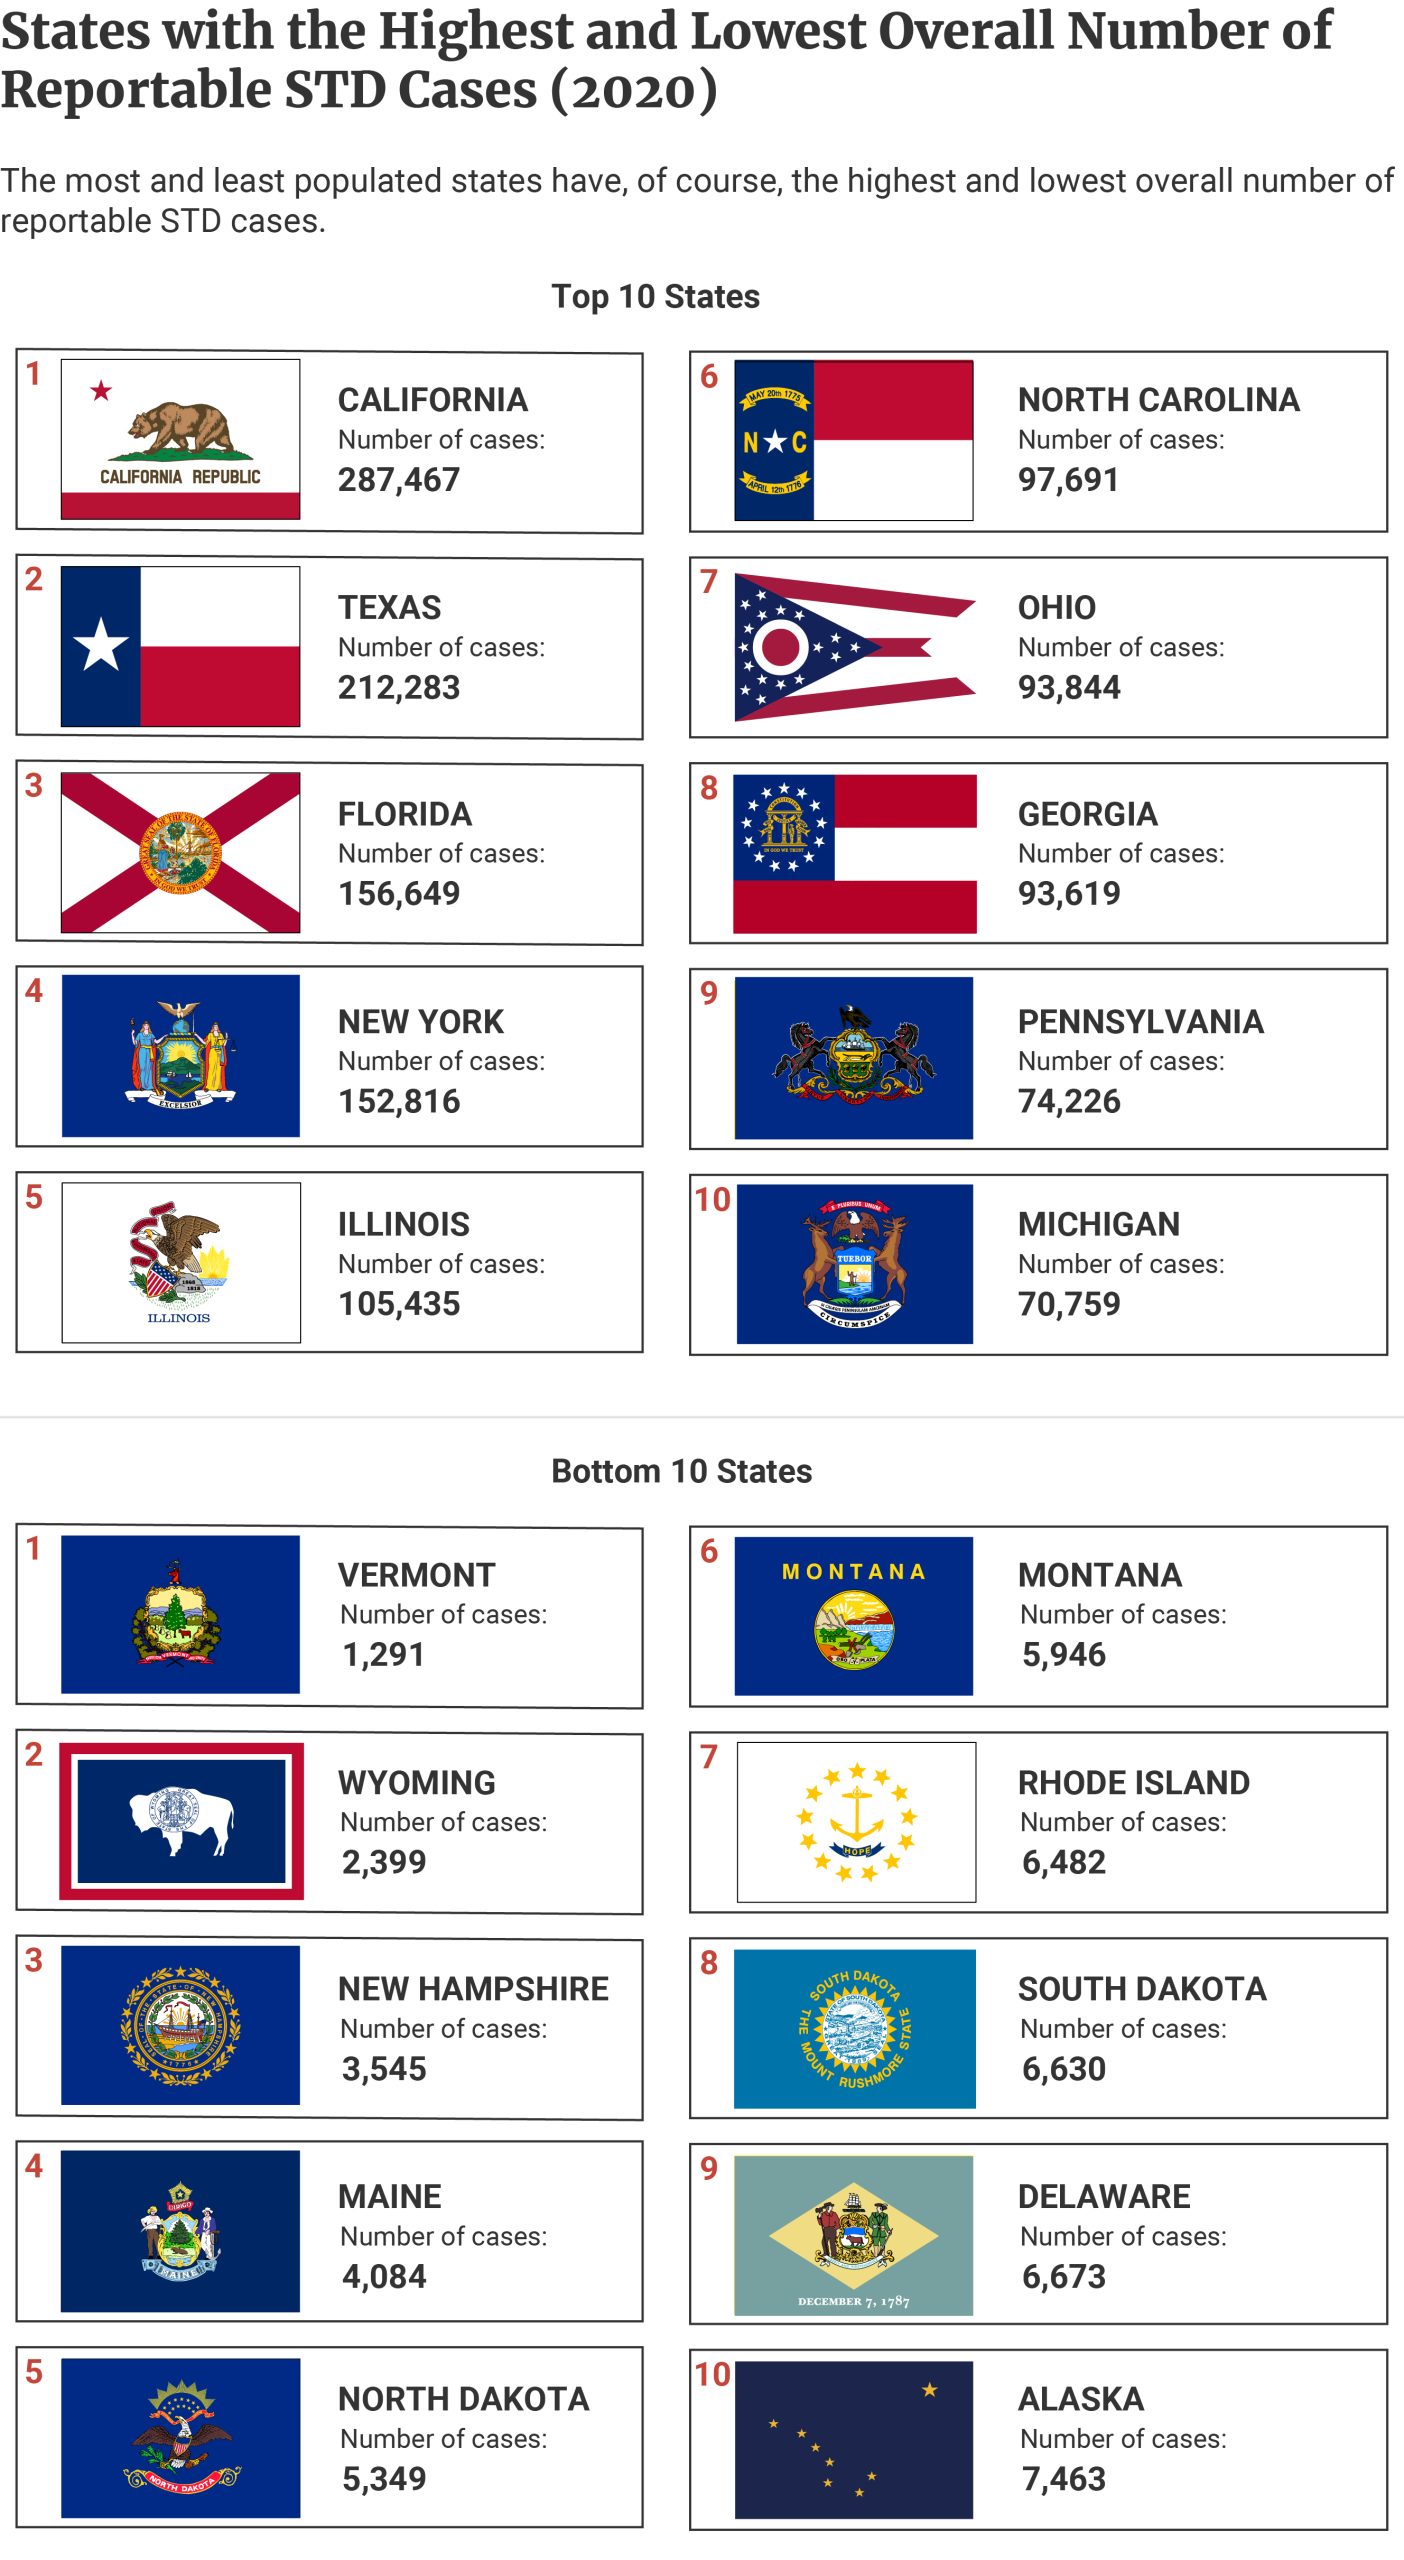
States with the Highest and Lowest Number of Reportable STD Cases
Regarding the total number of STDs, the states with the biggest populations have the highest number of new cases, of course. California tops the list with 287,467 new cases.
Texas follows with 212,283 cases, while Florida lands third with 156,649.
The states with the lowest total number of STD cases are those with lower populations, of course. Vermont tops the list with 1,291 new cases, while Wyoming has 2,399 new cases.
New Hampshire ranks third with 3,545 new cases.
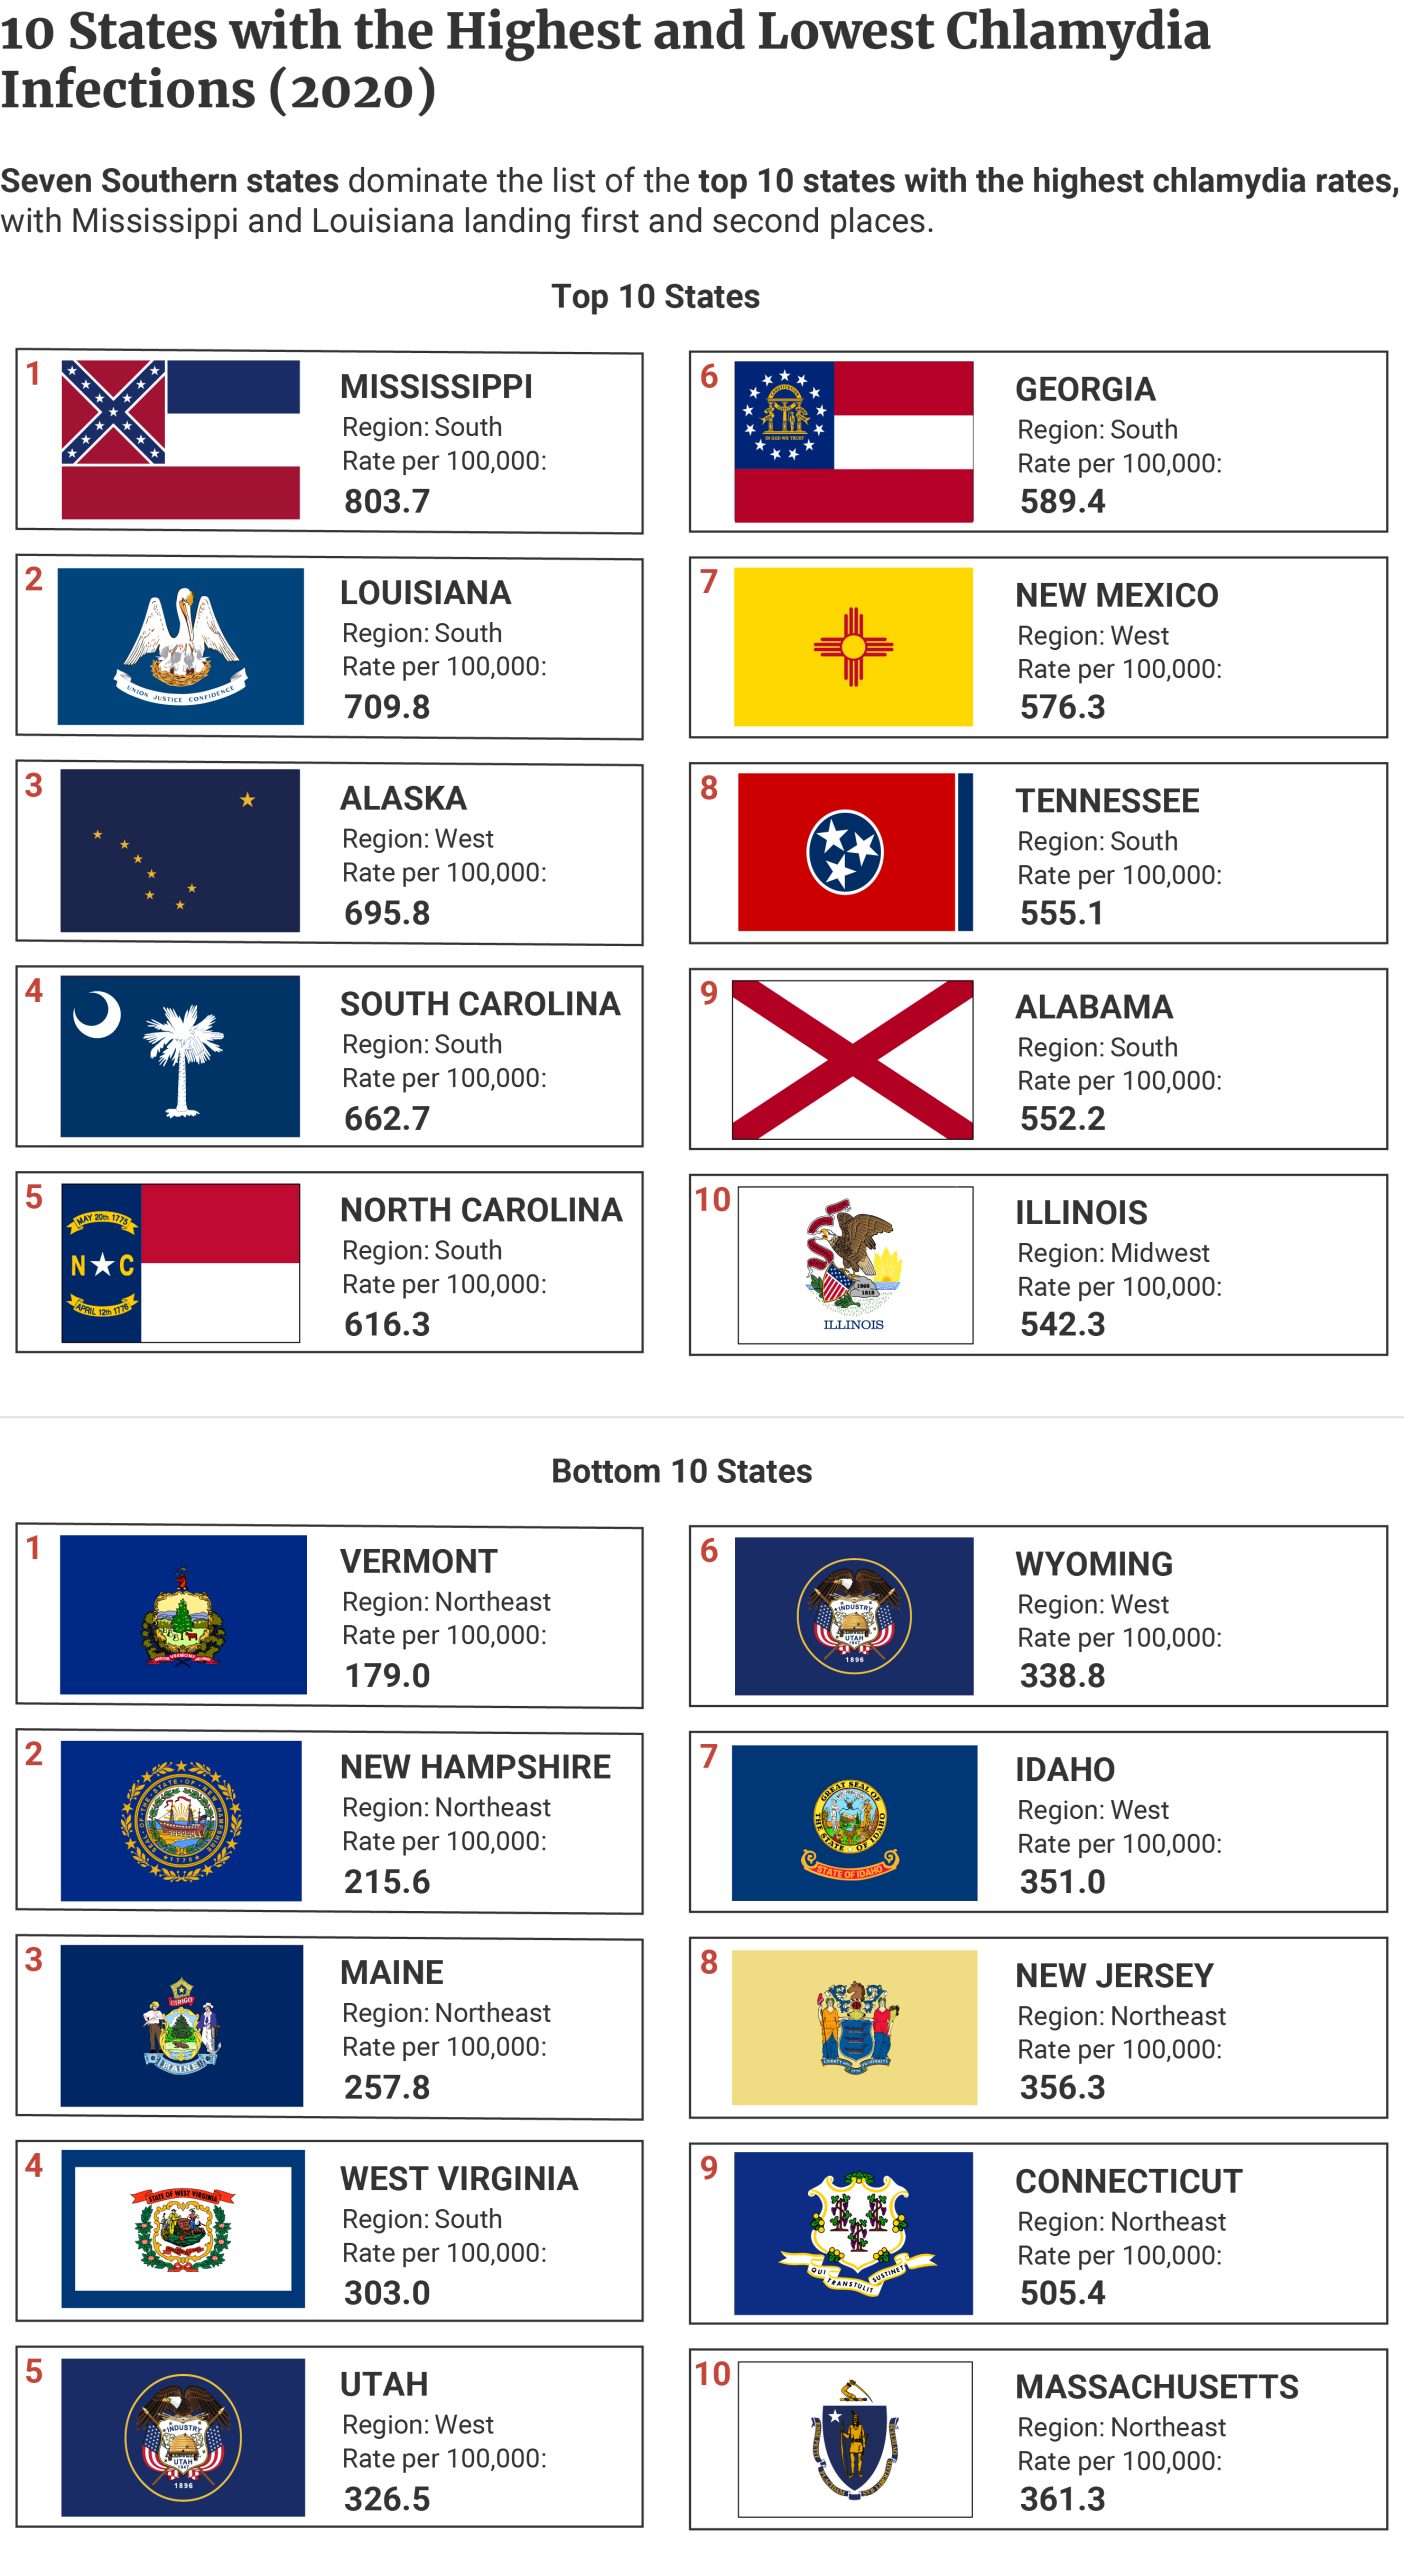
7 States from the South Have the Highest Chlamydia Infections (Per 100k)
Based on CDC’s 2020 report, the chlamydia rate in the US is 481.3 per 100,000 population. The country recorded 1.58 million new cases [9].
Report Highlights for Chlamydia Infection [9]:
- Seven Southern states landed in the top 10 states with the highest chlamydia infections.
- Mississippi ranked first. It has the highest chlamydia rate of 803.7 per 100,000 people. The state recorded 23,919 new cases.
- Mississippi’s chlamydia rate is 4.5 times higher than Vermont’s 179 per 100,000 population. The latter had the lowest chlamydia rate in 2020. Mississippi also has 21.4 times higher chlamydia prevalence than the latter’s 1,117, the lowest recorded in 2020.
- Louisiana ranked second highest with 709.8 per 100,000 persons. They recorded 32,997 new chlamydia cases.
- Alaska landed the third spot with 695.8 per 100,000 population. It’s the first Western state that got into the top 10 states with the highest chlamydia rates. The state recorded 5,090 new cases.
- Six out of the top 10 states with the lowest chlamydia infections come from the Northeast region, with Vermont having the lowest.
- West Virginia is the only Southern state that got into the list, landing the fourth spot. The state had 303 per 100,000 population rate and recorded 5,431 new chlamydia cases.
As for the highest number of newly reported chlamydia cases, the states with the biggest populations top the list.
California, with the largest population, recorded 178,679 new cases. Texas ranks second with 135,124 new cases, while Florida has 100,030 new cases [9].
Chlamydia Rate and Prevalence by Region
The Southern states suffer the most from chlamydia infections, affecting 529.1 per 100,000 Southerners. It also had the highest number of chlamydia cases in 2020 at 664,465 [9].
- The South has 1.28 times higher chlamydia rate than the Northeast, the latter having the lowest rate at 413.5 per 100,000.
- The South’s number of cases is also 2.87 times higher than the Northeast region. The latter recorded 231,488 new cases in 2020.
- The South comprised 42.1% of the country’s total chlamydia cases in 2020.
7 States from the South Have the Highest Gonorrhea Infections (Per 100k)
The US has a 206.5 per 100,000 population gonorrhea rate, says CDC’s 2020 report. 677,769 new infections were recorded in that year [10].
Report Highlights for Gonorrhea Infection [10]:
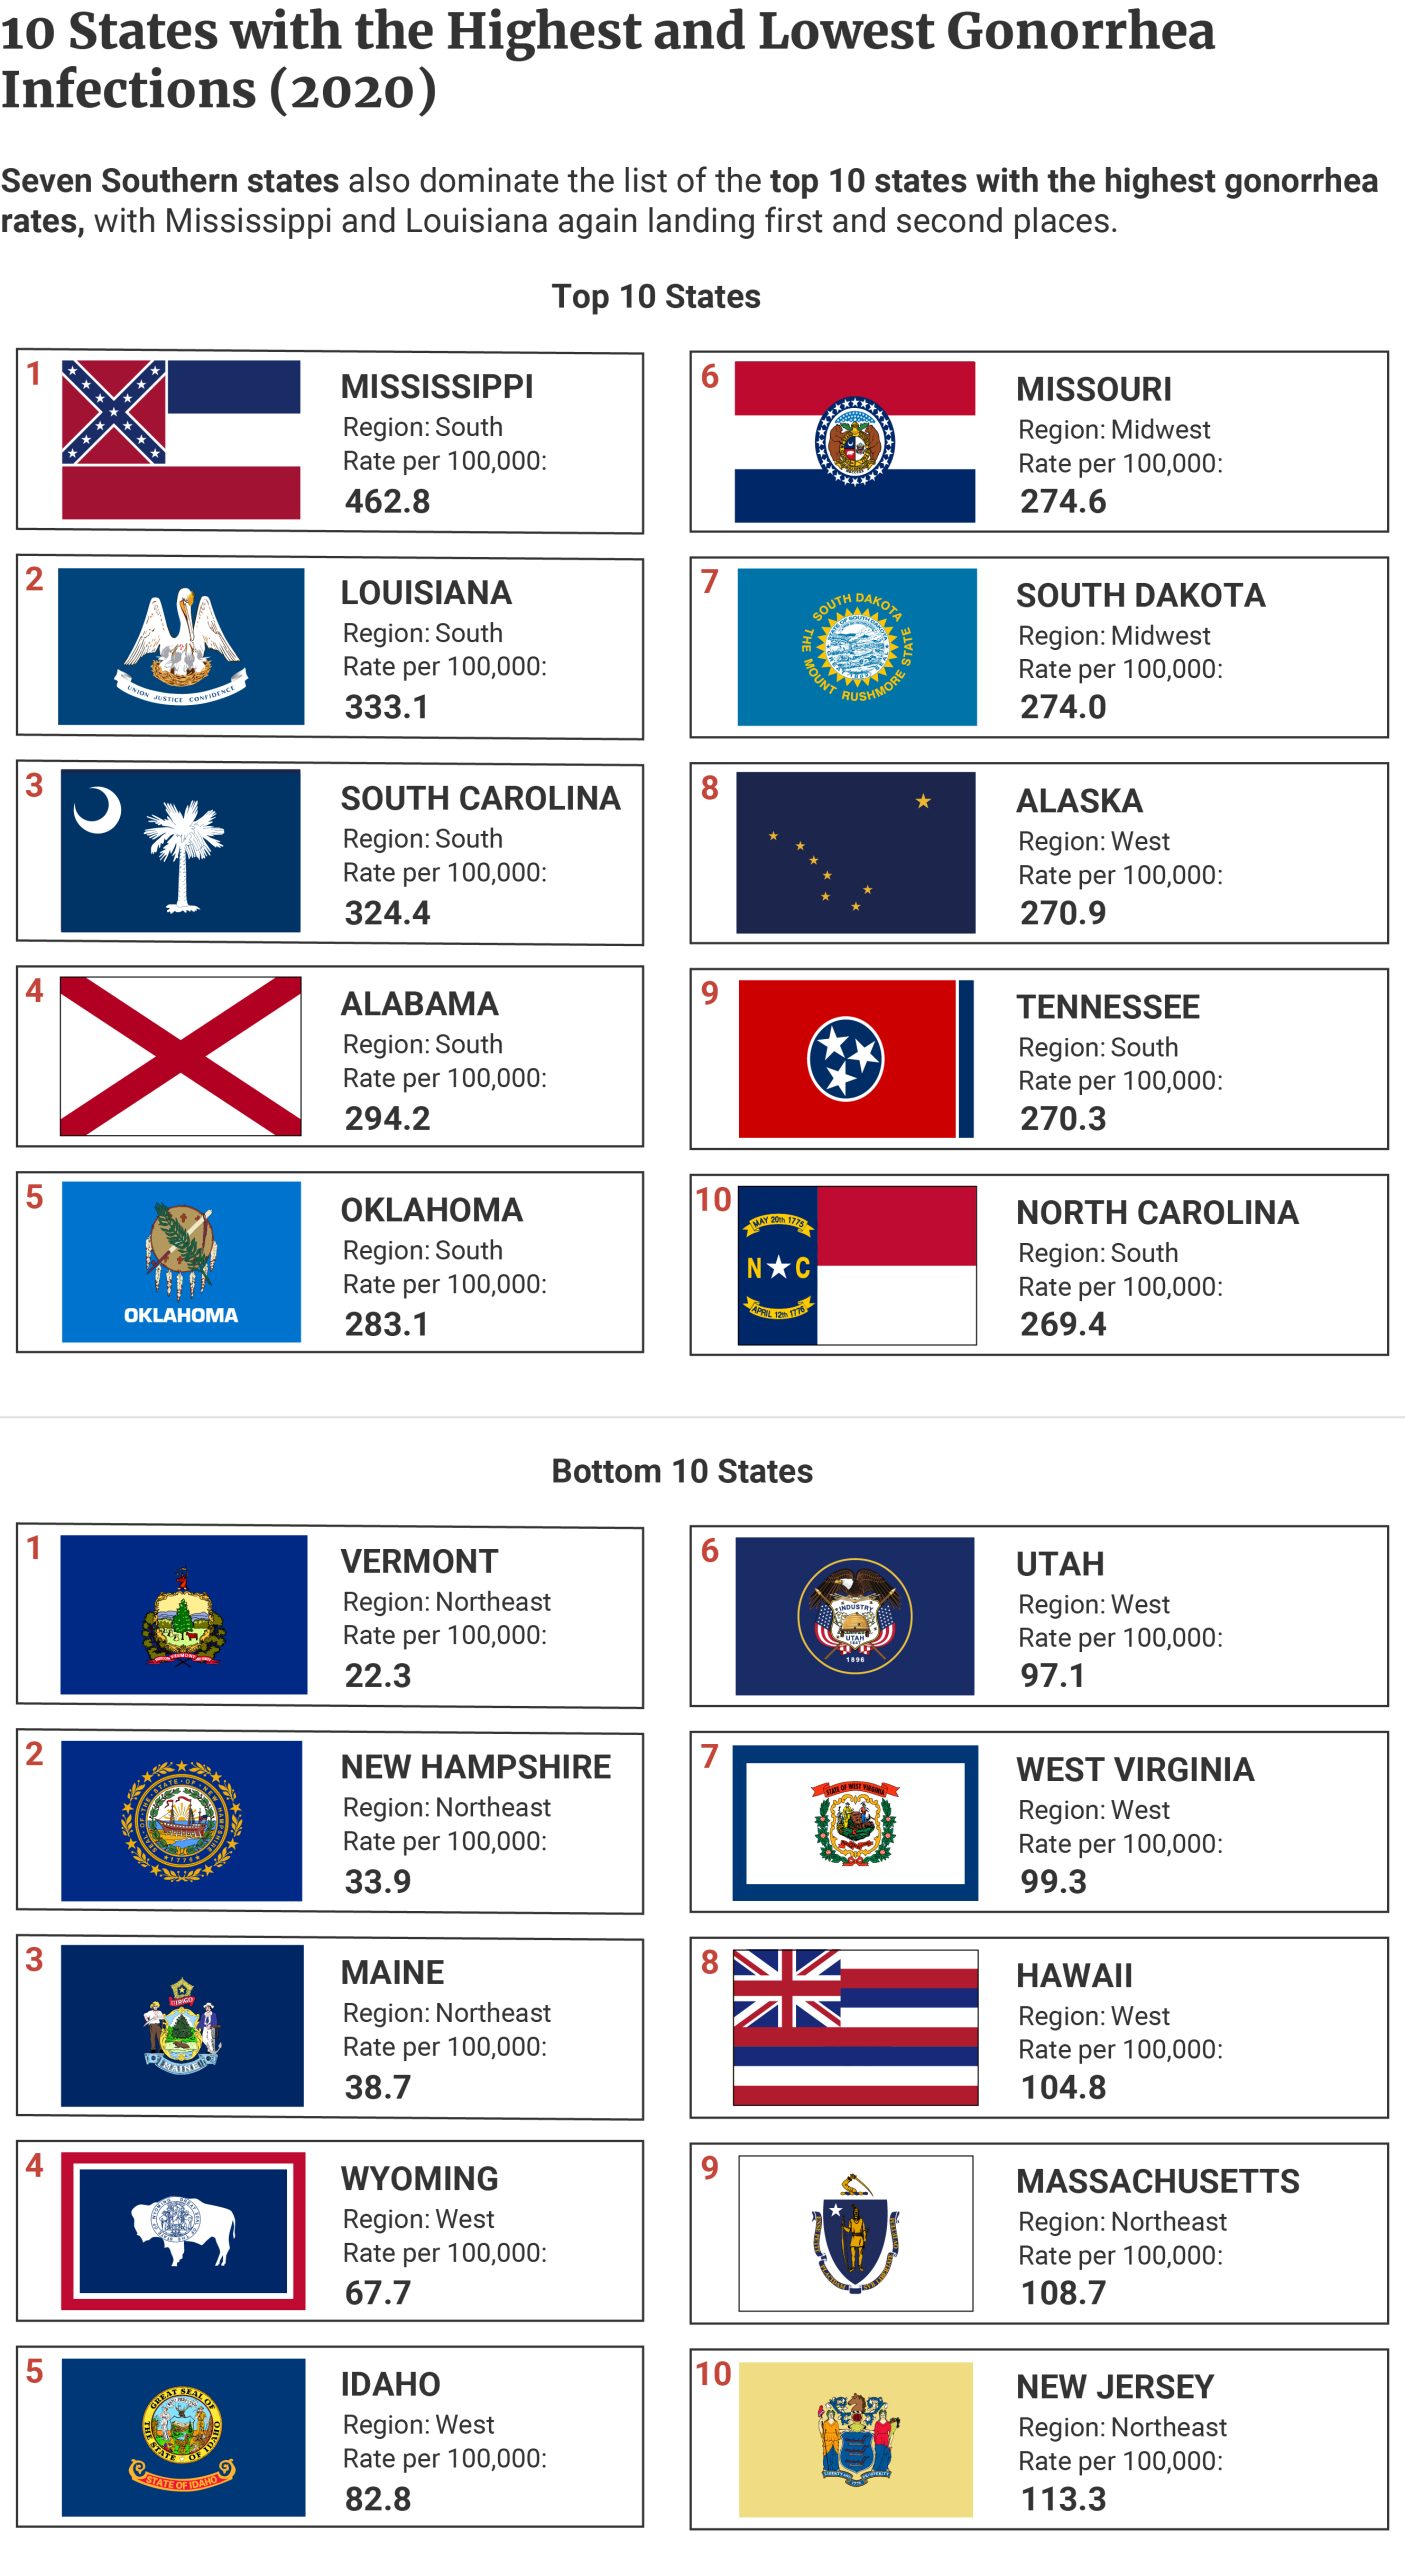
- Seven states from the South got into the top 10 states with the highest gonorrhea infections. Of the seven Southern states, five landed the first five spots.
- Mississippi, again, ranked first. For every 100,000 Mississippians, 462.8 people suffer from gonorrhea. The state recorded 13,773 new cases in 2020.
- Mississippi’s gonorrhea rate is 20.8 times higher than Vermont’s, the state with the lowest gonorrhea rate. Its number of cases is also 99.1 times higher than the latter.
- Louisiana ranked second highest with a rate of 333.1 per 100,000 population. They had 15,483 new cases in 2020.
- Five Northeastern states got into the top 10 states with the lowest gonorrhea rate.
- Vermont, again, ranked first. It has the lowest gonorrhea rate at 22.3 per 100,000 people. The state recorded only 139 new cases of gonorrhea.
- West Virginia is, again, the only Southern state that got into the list. They had a gonorrhea rate of about 99.3 per 100,000. They also recorded 1,780 new cases.

States with the biggest populations have, of course, the highest number of newly reported gonorrhea cases.
California has 78,444 new gonorrhea cases. Texas and New York recorded 58,246 and 42,517 new cases, respectively [10].
Gonorrhea Rate and Prevalence by Region
The Southern region has the highest gonorrhea rate in 2020, and the Northeast has the lowest [10].
- Gonorrhea affects 232.1 per 100,000 Southerners. It’s 1.52 times higher than the Northeast’s 152.7 per 100,000 people.
- Gonorrhea prevalence in the South is also 3.41 times higher than in the Northeast. The South recorded 291,485 new cases versus the Northeastern region’s 85,474 new cases.
- The South made up 43% of the country’s total gonorrhea cases in 2020.
5 States from the South Have the Highest Syphilis Infections (Per 100k)
Based on CDC’s 2020 report, the country recorded a syphilis rate of 40.8 per 100,000 people and 133,945 new cases [11].
Report Highlights for Syphilis Infection [11]:
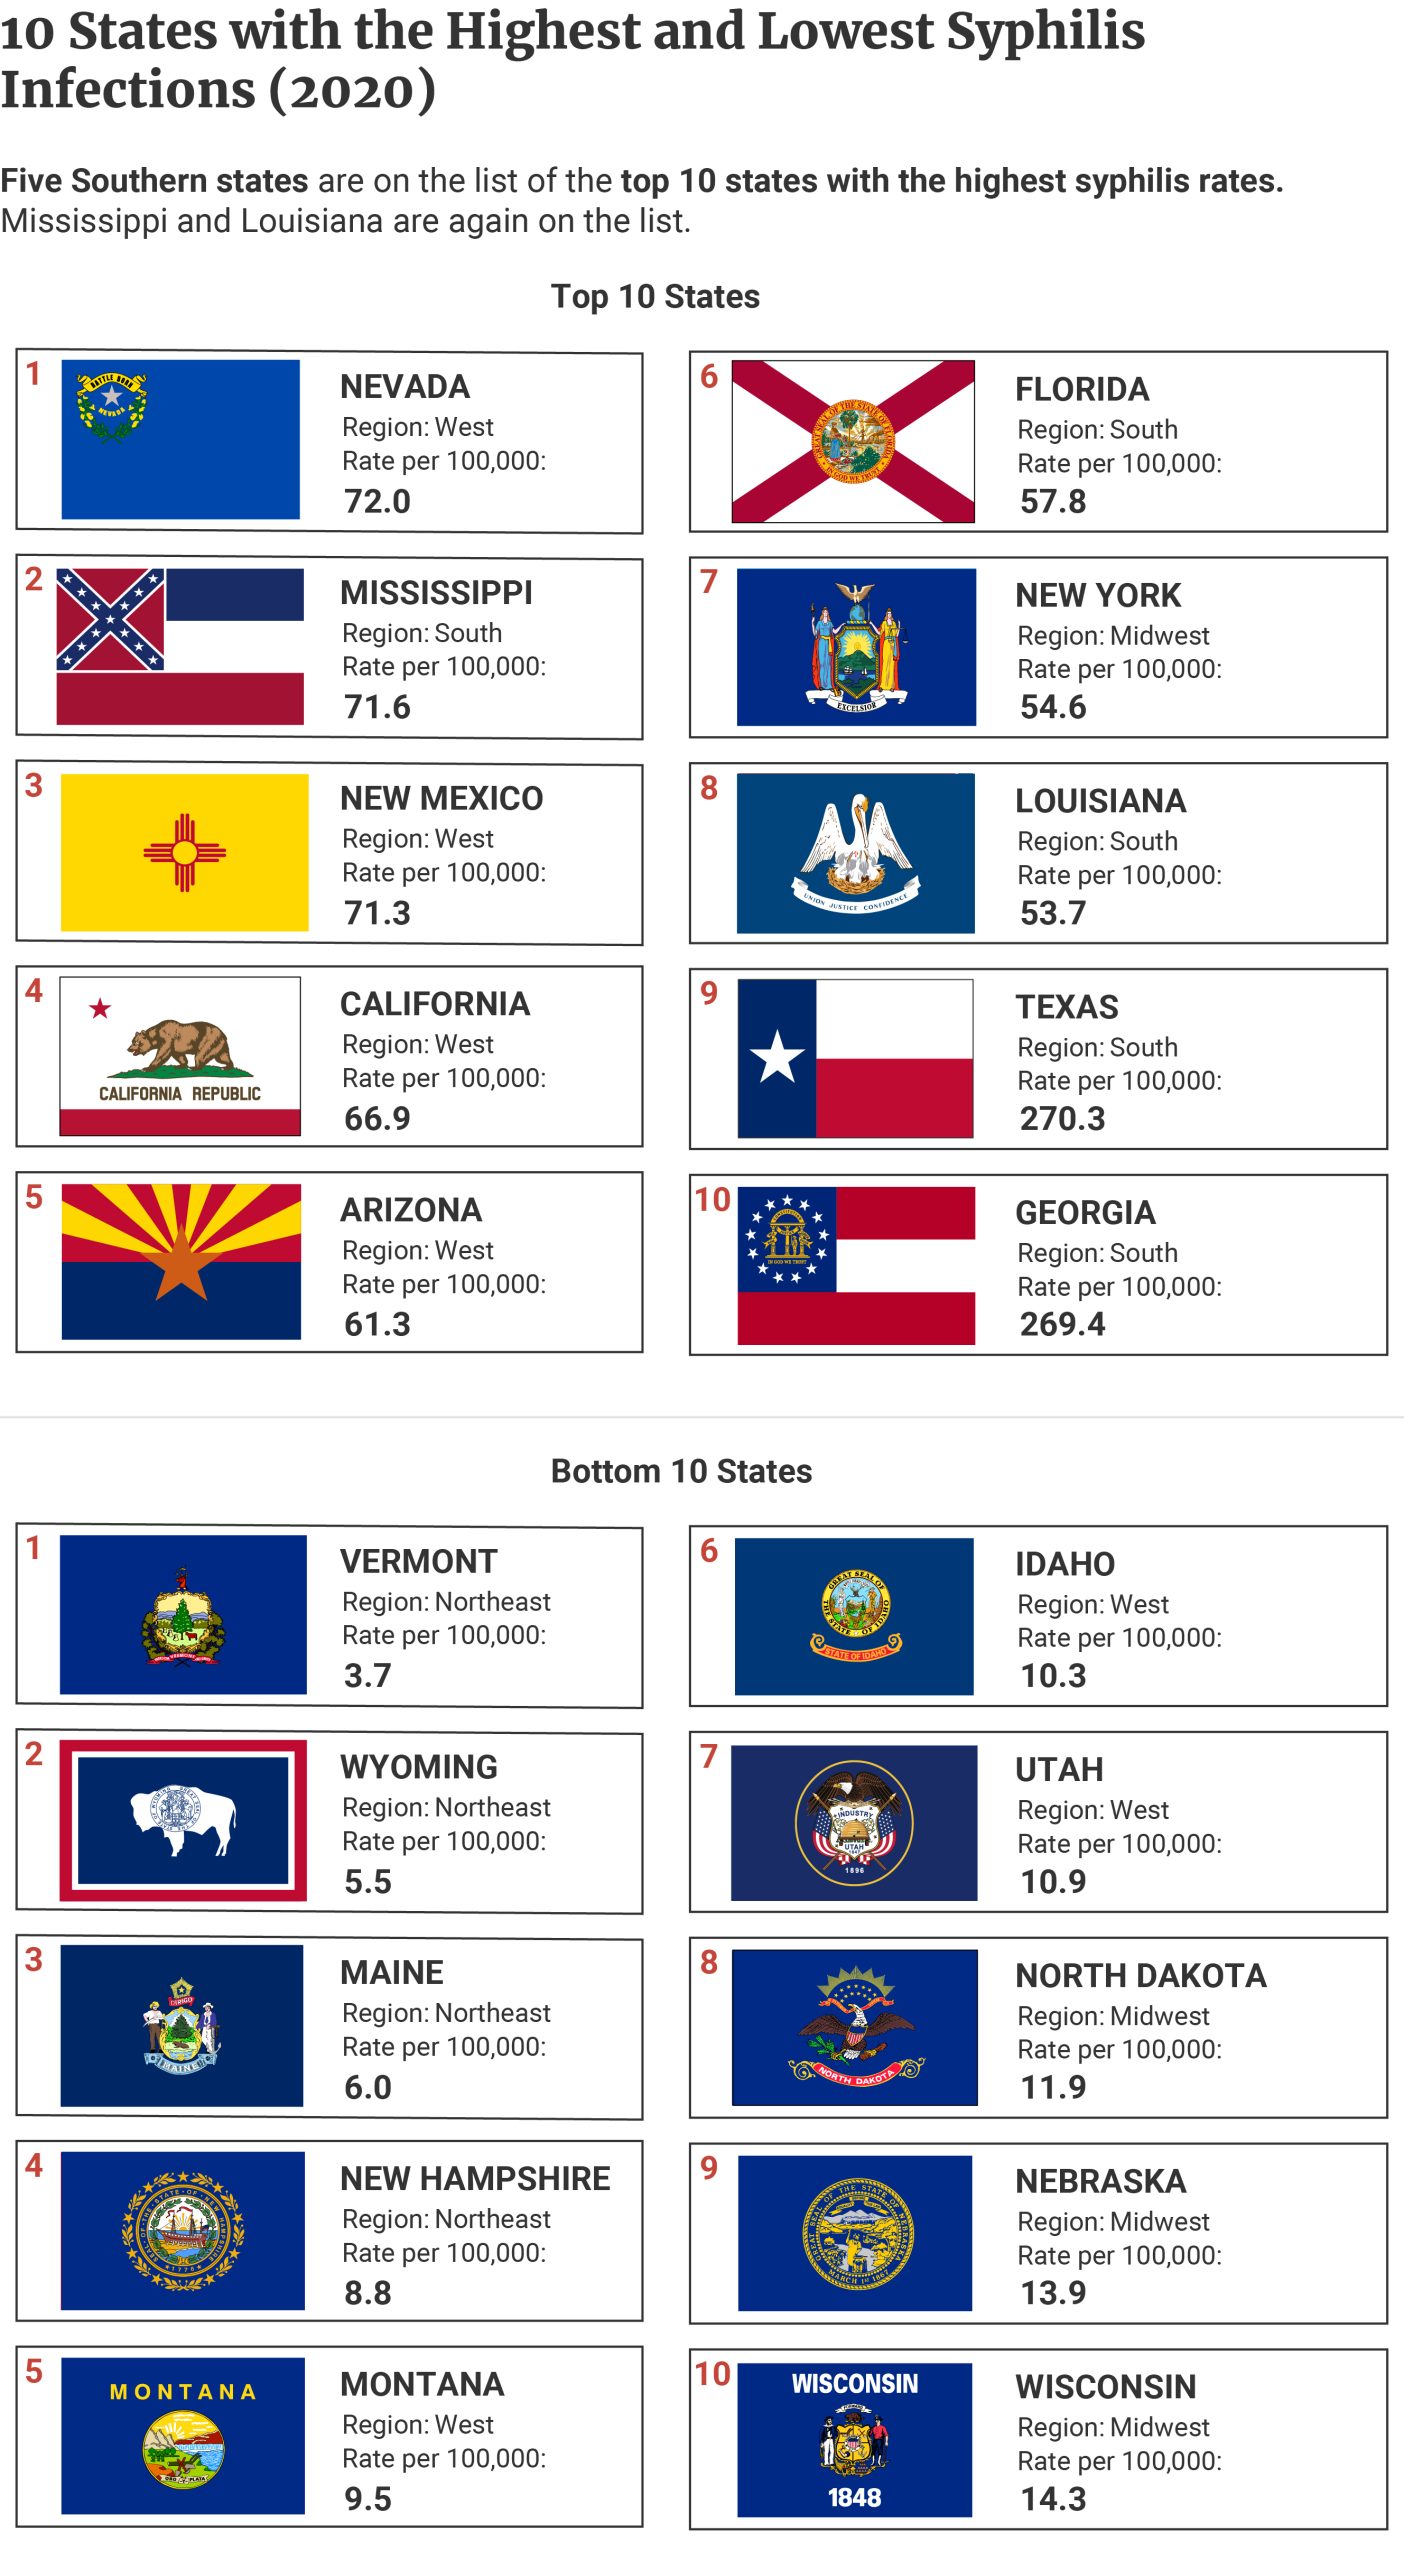
- Of the top 10 states with the highest syphilis infections, five came from the South, while four came from the West.
- The state with the highest syphilis rate is Nevada. The state had a 72 per 100,000 syphilis rate, with 2,218 new cases.
- Nevada has 19.5 times higher syphilis rate and 96.4 times higher syphilis prevalence than Vermont, the latter having the lowest rate and prevalence.
- Mississippi ranks second highest with 71.6 per 100,000 population. They recorded 2,131 new syphilis cases.
- Louisiana lands eighth place with a rate of 53.7 per 100,000 persons and 2,497 new infections.
- One Northeastern state also got into the top 10 list — New York. 54.6 per 100,000 New Yorkers got newly infected with syphilis in 2020. The state recorded 10,613 new cases.
- Vermont has the lowest syphilis rate, with 3.7 per 100,000 people. The state only had 23 new cases in 2020.
The number of new syphilis cases is highest in California with 26,414 new cases. Texas recorded 15,358 new cases, while Florida has 12,416 new cases [11].
Of note, syphilis cases include:
- Primary and secondary syphilis
- Congenital syphilis cases
- Early non-primary, non-secondary syphilis
- Unknown duration or late syphilis
According to the CDC, primary and secondary syphilis cases make up 31.1% of all syphilis cases in 2020 [6].
Syphilis Rate and Prevalence by Region
Of the four regions, syphilis affects the Western region the most in 2020 and the Midwest the least [11].
- 52.6 per 100,000 Westerners have syphilis, compared with 23.7 per 100,000 Midwesterners .The syphilis rate in the West is more than double (2.22 times) the syphilis rate in the Midwest.
- The region’s new syphilis cases are also more than double (2.54 times) than the latter. The West had 41,198 new syphilis cases in 2020, compared with the Midwest’s 16,218 new cases.
- The West may have the highest rate, but the South lags only a few points behind the West.
- The South recorded a rate of 46.1 per 100,000.
- The region also has the highest number of new syphilis cases, with 57,901 infections.
- The South comprised 43.2% of the country’s total syphilis cases in 2020.
9 States from the South Have the Highest HIV Infections (Per 100k)
The CDC’s report shows 9.2 in 100,000 Americans got newly infected with HIV in 2020. The country recorded 30,403 new cases [4].
Report Highlights for HIV Infections [4]:
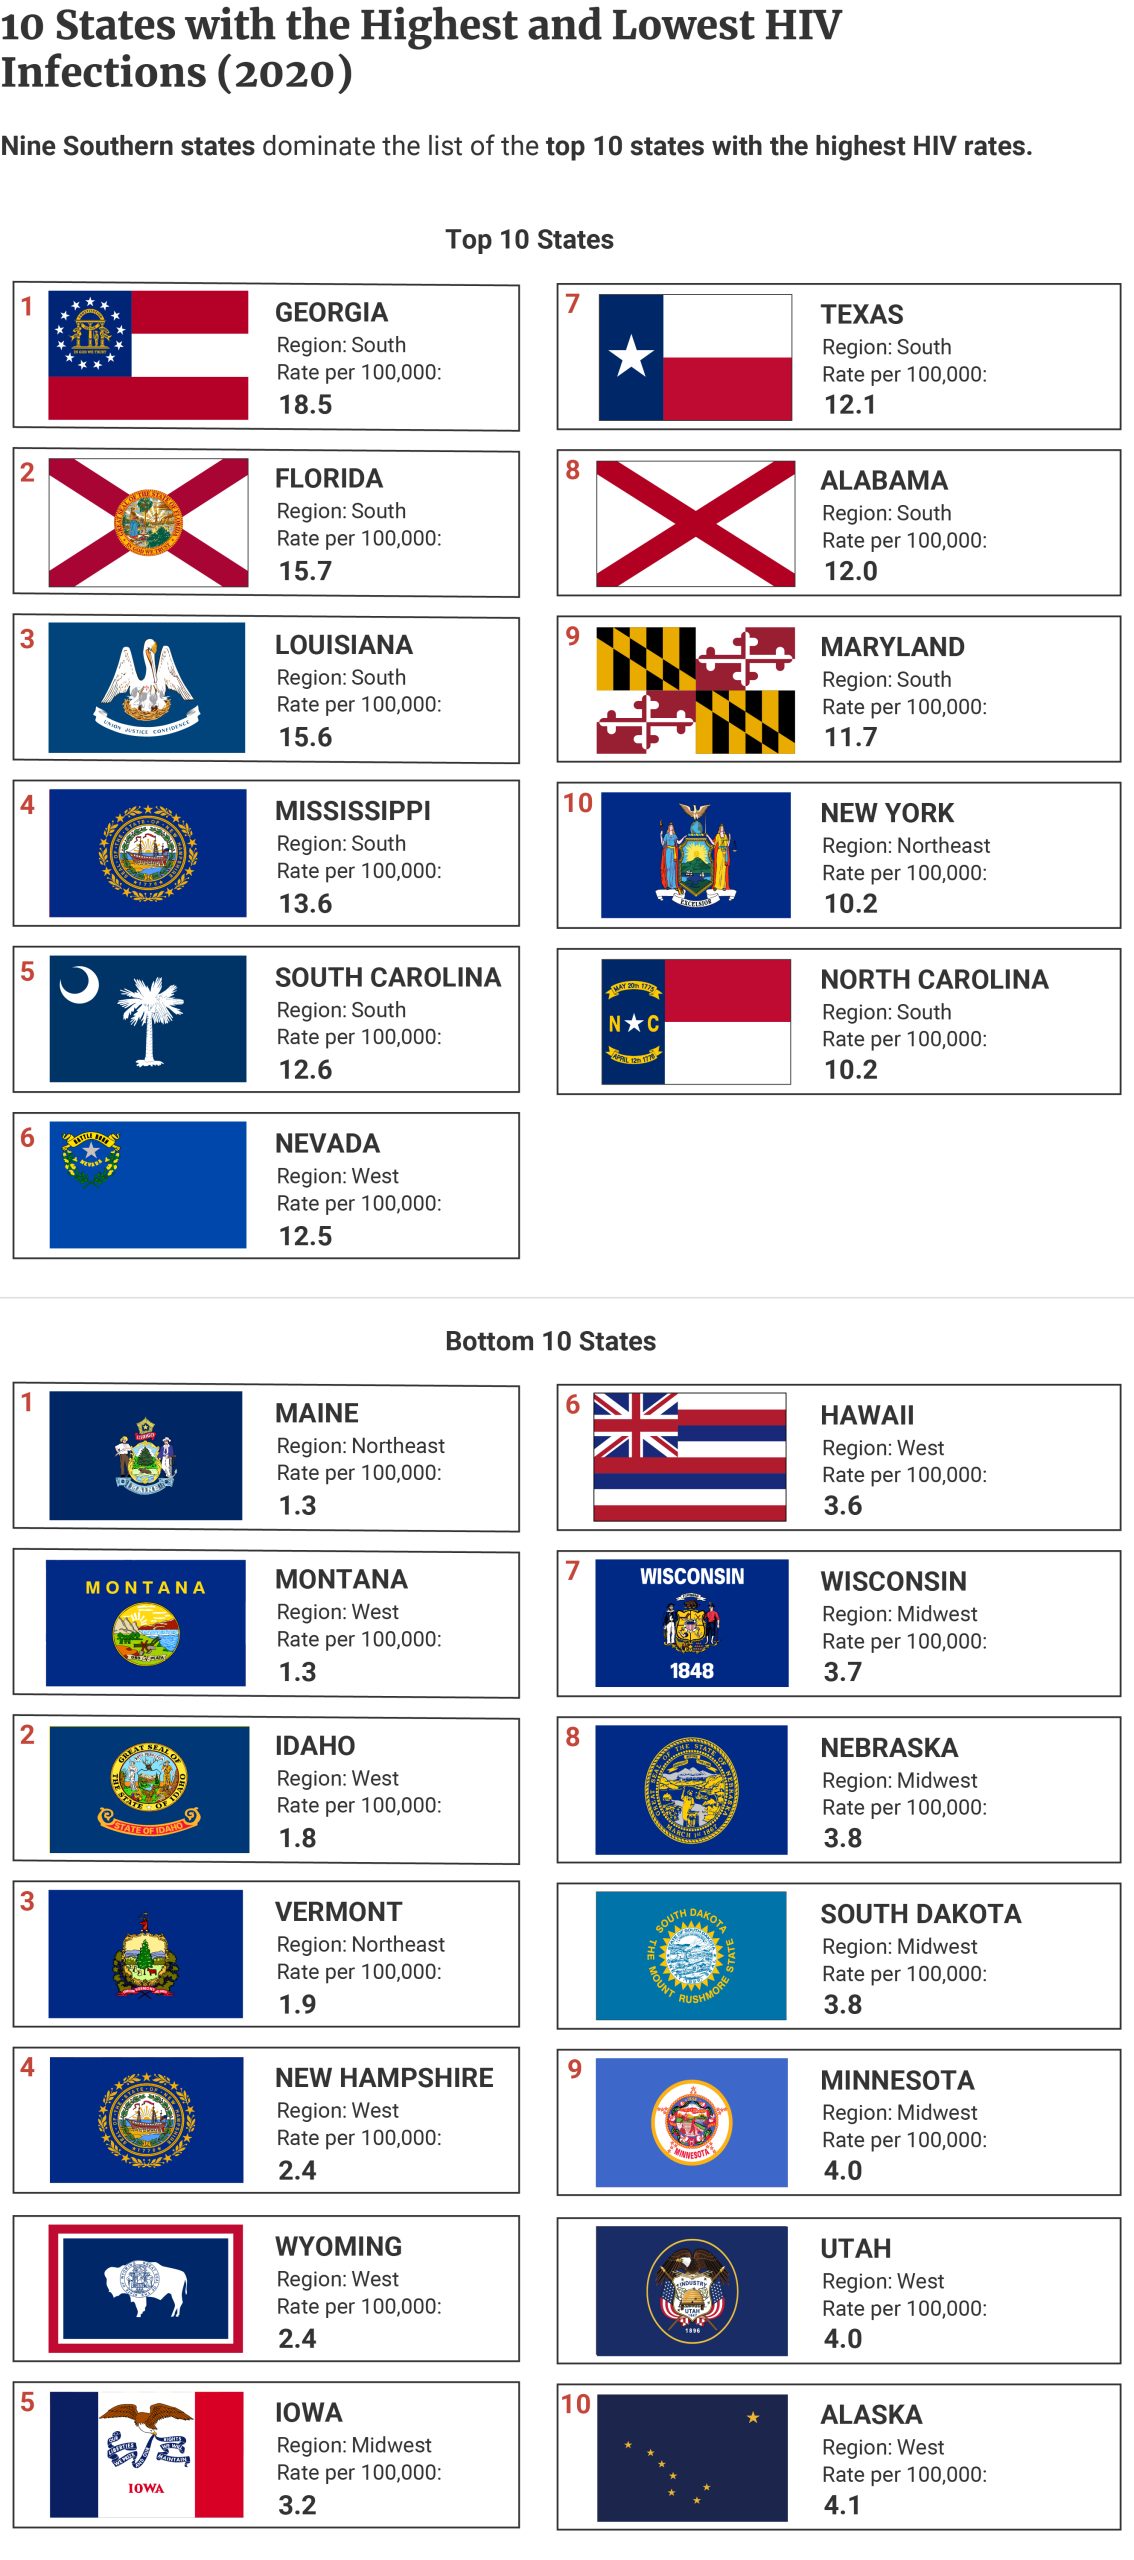
- Southern states, again, dominated the top 10 states with the highest HIV infections. Of the top 10, nine came from the South.
- Georgia has the highest HIV rate of 18.5 per 100,000 people. The state recorded 1,978 new infections.
- Georgia’s HIV rate is 14.2 times higher than Maine and Montana’s, the states with the lowest HIV rate. The state’s new HIV cases are also 116.4 and 141.3 times higher than Maine and Montana’s.
- Louisiana lands the third and Mississippi the fourth spot with HIV rates of 15.6 and 13.6 per 100,000 people, respectively. Louisiana recorded 723 new cases, while Mississippi 402.
- The only non-Southern states that got into the top 10 list are Nevada and New York. The states had HIV rates of 12.5 and 10.2 per 100,000 people, respectively. Nevada reported 392 new infections, while New York 1,964.
- Maine and Montana, as stated earlier, had the lowest HIV rates at 1.3 infections per 100,000 people. Montana recorded 14 new cases, while Maine 17.

New HIV cases are highest in California (3,930), Texas (3,555), and Florida (3,415) [4].
HIV Rate and Prevalence by Region
The Southern region, again, has the highest HIV infections in the country [4]:
- 12.4 per 100,000 Southerners got newly infected with HIV. Its rate is 2.07 times higher than the Midwest, the latter having the lowest at 6 per 100,000 population.
- The South also recorded the highest number of new HIV cases, with 15,689 infections. It’s 3.80 times higher than the Midwest’s 4,127 new cases.
- More than half (51.6%) of the country’s new HIV cases came from the South.
Why are STD Rates Highest in the South?
The South has the highest rates of three reportable STDs — chlamydia, gonorrhea, and HIV. The region may not have ranked first in syphilis, but its rate is only 6.5 points behind the West. When considering the number of new syphilis cases, the South is 33.7% higher than the West (57,901 vs. 41,198) [11].
But why is this so? Why do STDs affect the Southern states the most?
Socioeconomic Factors that Affect a State’s STD Rate and Prevalence
Before we delve into this, let’s first look at some factors that may increase a state’s STD prevalence and rate. These include:
- Education and poverty
- Access to insurance and quality healthcare
- Stigma
Education and Poverty
These two factors have a very close connection with each other.
Low educational attainment means less exposure to health education. These include information about safe sex practices and sexually transmitted infections or diseases.
Lack of education and dropping out of school contribute to poverty in many ways. It means unemployment and the inability to get better jobs. It also makes the person less self-sufficient and more dependent on government dole-outs.
Parents who earn lower income are, more often than not, also unable to send their children to better schools. Then the cycle continues.
The lower the educational attainment, the higher the poverty rate.
Access to Insurance and Quality Healthcare
People with lower educational and income levels are more likely to face unemployment. They’re also more likely to be uninsured or working at a job with very poor health coverage.
Lack of insurance and health care access prevents people from getting tested for STDs and receiving treatment. The longer an STD stays untreated, the higher the risk of infecting others.
Untreated STDs can result in serious complications such as:
- Pelvic inflammatory disease
- Cervical cancer
- Infertility
- Ectopic pregnancy
- Mother-to-child congenital infections and birth defects
Stigma
The stigma associated with STDs also plays a role. It acts as a barrier to getting tested and treated for STDs.
Stigma also affects one’s willingness to provide information about their partners. Failure to notify their partners about the possibility of contracting an STD means:
- Increased STD transmission risk to other people
- Delayed treatment
All these, of course, increase a state’s STD rate and prevalence.
The South has the Highest Socioeconomic Risk Factors
Of the different regions, the South has the highest socioeconomic risk factors that increase the state’s STD rate and prevalence.
Let’s see how the regions differ based on these factors.
Education
Higher education correlates with less poverty [8].
- The poverty rate among people with a Bachelor’s degree or higher is 4.1%. It’s 6.6 times lower than the poverty rate of those without a high school diploma of 27.2%
- High-school graduates (no college diploma) have a poverty rate of 13.2%.
- It’s 9.2% among those with some college.
Of the four regions, the South and the Midwest have the lowest percentages of people (aged 25 and older) with a Bachelor’s degree or higher at 33.1% each. It’s highest in the Northeast at 40.1% and West at 36% [3].
The Southern and Western regions have the highest percentages of people with less than a high school education [3].
- 11.4% of Southerners and 12.2% of Westerners aged 25 and older have less than a high school educational attainment.
- It’s lowest in the Midwest at 8.1% and Northeast at 9.7%.
Poverty
The South has the highest poverty rate, compared with other regions [2].
- 13.3% of Southerners live below poverty.
- It’s lowest in the Midwest at 10.1%.
- The West and Northeast regions have poverty rates of 10.6% and 10.2%, respectively.
The South also has the lowest median income of $64,355 in 2020. It’s 20.5% lower than the Northeast [7]:
- The Northeast has the highest median income of $79,032.
- The Western region has a median income of $78,755.
- Midwest’s median income is $70,528.
Percentage of Uninsured
The percentage of uninsured people is highest in the South and lowest in the Northeast region in 2020 [5].
- 11.8% of Southerners don’t have insurance.
- On the other hand, 8.3% of Westerners, 6.3% of Midwesterners, and 4.9% of Northeasterners are uninsured
- 16.5% or working-age adults in the South have no health insurance coverage.
- The West has a rate of 11.4%, the Midwest of 8.6%, and the Northeast of 6.7%.
Healthcare Quality
US News ranked the states based on healthcare access, healthcare quality, and public health [1].
- Eight out of the top 10 states with the worst healthcare come from the South.
- Mississippi ranked the worst.
- Arkansas and Oklahoma ranked second and third.
- West Virginia, Louisiana, Alabama, Kentucky, and Georgia follow.
- Maryland is the only Southern state that got into the top 10 states with the best healthcare, landing sixth place.
- Hawaii has the best healthcare in the country, followed by Massachusetts and Connecticut. New Jersey and California land fourth and fifth places.
Stigma
Many factors contribute to STD-related social stigma in the South. These include poverty, lack of education, racial discrimination, gender, religion, and sexual behaviors. The region’s conservative culture, especially around sex, also contributes to STD stigma.
The lack of STD awareness and prevention also negatively impacts the region’s STD rates.
HIV, in particular, is most prevalent in the South. The region not only has the highest HIV rates but the number of cases as well. Of the top 10 states with the highest HIV rates, nine came from the South. However, the region has the lowest HIV pre-exposure prophylaxis (PreP) services.
However, the region has the lowest HIV pre-exposure prophylaxis (PreP) services [12].
- The South only has 4.4 providers per 100 patients who need PreP services.
- The Northeast region (which is only about 44% of the South’s population) has double the number of providers per person with PreP indications. It has the highest need to PreP ratio at 8.5 per 100.
- The West has 6.2 per 100, while the Midwest has 5.7 per 100.
It isn't easy to overcome these challenges to achieve STD health equity, especially in the South. But increasing STD education and prevention awareness can help reduce disease transmission. It can also help break down some of the barriers caused by STD social stigma.
Final Thoughts on STD Rates by State and STD Support
The Southern states have the highest STD risk factors. These may have contributed to why the region has the highest reported STD cases and rates. Looking at the data, eight of the top 10 states with the highest overall STD rates come from the South.
While achieving health equity is difficult, we can at least help close the gap through STD education and prevention, especially among sexually active people.
For more information about STDs, including HIV, you may get in touch with the following organizations:
- CDC National STD Hotline: cdc.gov/std or 1-800-227-8922
- HIV/AIDS Hotline: ryanwhite.hrsa.gov/hiv-care/hotlines
References
- Best States for Healthcare. (2023). US News. [1]
- Creamer, J., Shrider, E. A., Burns, K., & Chen, F. (2022). Poverty in the United States: 2021. In U.S. Census Bureau. U.S. Government Publishing Office. [2]
- Educational Attainment. (2022). U.S. Census Bureau. [3]
- HIV Surveillance Report, 2020. (2022). Centers for Disease Control and Prevention. [4]
- Keisler-Starkey, K., & Bunch, L. N. (2022). Health Insurance Coverage in the United States: 2021. In U.S. Census Bureau. U.S. Government Publishing Office. [5]
- National Overview of STDs, 2020. (2022). Centers for Disease Control and Prevention. [6]
- Semega, J., & Kollar, M. (2022). Income in the United States: 2021. In U.S. Census Bureau. U.S. Government Publishing Office. [7]
- Statista Research Department. (2022). Poverty rate in the United States in 2021, by level of education. Statista. [8]
- Table 3. Chlamydia — Reported Cases and Rates of Reported Cases by State/Territory and Region in Alphabetical Order, United States, 2016-2020. (2022). Centers for Disease Control and Prevention. [9]
- Table 8. Gonorrhea — Reported Cases and Rates of Reported Cases by State/Territory and Region in Alphabetical Order, United States, 2016-2020. (2022). Centers for Disease Control and Prevention. [10]
- Table 12. Total Syphilis* — Reported Cases and Rates of Reported Cases by State/Territory and Region in Alphabetical Order, United States, 2016-2020. (2022). Centers for Disease Control and Prevention. [11]
- Zhu, W., Huang, Y. A., Kourtis, A. P., & Hoover, K. W. (2021). Trends in the Number and Characteristics of HIV Pre-Exposure Prophylaxis Providers in the United States, 2014–2019. Journal of Acquired Immune Deficiency Syndromes, 88(3), 282–289. [12]
