Chronic Back Pain Statistics in the US (2025)

Report Highlights:
- Back pain is a leading cause of work limitations globally [32].
- In 2018, 75.8 million American adults — or 29.9% of individuals aged 18 and older — suffered from lower back pain [22].
- 15% to 20% — or 3 to 4 in 20 adults— have back pain (or spine pain) during a single year [25].
- 50% to 80% of adults will experience at least one episode of back pain during their lifetime [25].
- Females are more likely to suffer from low back pain at 31.6% — or more than 3 in 10 — compared to 28% of males [22].
- Low back pain is most prevalent in people aged 75 and older at 37.3% and least prevalent in ages 18 to 44 at 24.4% [22].
- In 2016, low back pain was the leading cause of years lived with disability (YLDs) among adults in the United States — accounting for about 3.07 million YLDs [28].
- Back pain statistics show that this condition is one of the most expensive conditions to treat in aggregate — accounting for over $100 billion in care each year [12].
- Physical therapy is perceived to be the most effective treatment for back pain — and it reduces the costs of back pain treatment by 72% within the first year of treatment [10].
- Nearly 3 in 5 patients (56.7%) recover their work capability six months after having back pain [15].
- 69% or every 7 in 10 adults experience recurrent back pain within 12 months after recovery [7].
What is Back Pain?
The National Institute of Arthritis and Musculoskeletal and Skin Diseases (NIAMS) defines back pain as steady, persistent, aching pain, or sudden and intense pain that affects any part of the back and can appear suddenly or slowly [23].
According to the NIAMS, there are three main types of back pain, including:
- Acute back pain. This type of back pain is sudden and lasts from a couple of days to more than a couple of weeks.
- Subacute back pain. This type of back pain lasts from 4 to 12 weeks and can be sudden or develop over time.
- Chronic back pain. An individual typically has chronic back pain if the pain persists for over 12 weeks. This type of pain may appear both quickly or develop slowly.
What Is the Most Common Type of Back Pain?
Chronic back pain takes several forms caused by soft tissue injuries, herniated discs, degenerative injuries, and fractures. The two most common ones are nonspecific back pain and nerve root pain.
Nonspecific Low Back Pain
The most common type of back pain is nonspecific nerve back pain. Approximately 85% of low back pain is classified as nonspecific [16].
This type of back pain is known as nonspecific because it has an unclear cause. Most cases of an acute type of low back pain are categorized as nonspecific. The majority of people will have nonspecific low back pain at some point in their lives [29].
Nerve Root Pain
The second most common type of back pain is nerve root pain (sciatica), which affects less than 5% of cases of acute low back pain [29].
Nerve root pain is pain coming from an irritated (or pressed on) nerve emerging from the spinal cord. A prolapsed disc — also known as a slipped disc — is the main cause of nerve root back pain in nearly 90% of cases [29].
Who Is At Risk for Developing Lower Back Pain?
Low back pain is a significant public health issue affecting every age group, including children [30].
According to the National Institute of Neurological Disorders and Stroke, the following risk factors might pose a greater risk of developing back pain [24]:
- Age. Back pain becomes more common as you get older — people experience the first attack through ages 30 and 50.
- Fitness level.People who are not physically fit are at a greater risk of developing low back pain.
- Excess weight. People who are overweight, obese, or quickly gain significant amounts of weight can develop it because excess weight can put stress on the back.
- Genetics. Ankylosing spondylitis, a disorder with a genetic component, can be a cause of back pain.
- Job-related risk factors: Physically demanding jobs that entail heavy lifting or twisting the spine are hard on the back and can lead to back pain-related injuries. While increased physical activity affects the development of chronic low back pain, a sedentary lifestyle is a significant risk for its recurrence [6].
- Mental health: Psychological distress like anxiety and depression can influence the perception of the severity of back pain in the individual.
- Smoking: Smoking hurts the back in several ways. First, it damages the arteries of the back’s discs, which may lead to injury and pain. Second, smoking increases the risk of osteoporosis and hip fracture due to bone-thinning [27].
- Backpack overload in children: Overloaded backpacks combined with poor fit to the child’s frame can strain the back and cause muscle fatigue.
What Are the Causes of Back Pain?
Strains (an injury like a pulled muscle) and sprains are common reasons for back pain [2].
Stress & Physical Work
A study (2017) found that, out of 711 respondents, 29% believed stress was the cause of their back pain, while 17% believed an accident was the cause of their back pain [17].
Poor Sleep Quality
A study (2020) investigated the association between poor sleep and the risk of low back pain in Danish healthcare workers. It found that [31]:
- Poor sleep significantly influences the development of low back pain in healthcare workers.
- 43.9% of healthcare workers experienced moderate sleep, 24.4% experienced poor sleep, and 31.7% reported good sleep. Moderate and poor sleep increased the odds of having low back pain at 66% and 105%, respectively.
- Healthcare workers who reported better sleep scores were free from back pain.
COVID-19
43.6% among 133 patients with COVID-19 reported back pain, making this condition one of the most common complaints. The primary complaint of COVID patients was myalgia and arthralgia at 69.2%, followed by headache at 50.4% [20].
Out of all complaints of patients with COVID-19, 69.3% were about pain. Among 133 COVID-19 patients who reported pain, back pain (58 patients or 43.6%) and low back pain (44 patients or 33.1%) accounted for 102 complaints or 76.7% [20].
Back Pain Statistics: What Percentage of The Population Has Back Pain?
In 2018, 75.8 million American adults — or 29.9% of individuals aged 18 and older — suffered from lower back pain [22].
Back pain is a leading cause of work limitations globally [32]. It’s also one of the most common reasons people see a doctor and face challenges in everyday activities [24].
Reports show that [25]:
Low back pain affects at least 15% of people during a single year and 50% to 80% of people experience an episode of low back pain during their lifetime.
LBP can be caused by several risk factors, including physical and mental state, socioeconomic status, and occupation. It affects all ages and is a prominent cause of disability in the workforce, carrying an immense economic and social burden.
![]()
![]()
Is Back Pain on the Rise Globally?
The global back pain prevalence decreased slightly from 1990 to 2017 [32].
According to a systematic analysis for the Global Burden of Disease Study (2017), there has been an insignificant decrease in frequency of low back pain from 1990 to 2017 at the point prevalence of 0.05 [32].
But, the total number of cases of individuals with low back pain and YLDs has increased dramatically in this period [32].
In 1990, 377.5 million people suffered back pain compared to 577 million people in 2017.
The increase in back pain likely correlates with the rise in the working — and aging — population.
A sedentary lifestyle may be another reason for an increase of low back pain globally.
Data from 2016 shows that 27.5% — or more than 5 out of 20 people — of the global population don’t do enough physical activity within a single year [13].
Is Back Pain on the Rise in the United States?
In 2001, the prevalence of low back pain was 31.1%. This percentage dropped to 29.9% in 2018 despite the increase in adult population of 19.36% during this period [22].
By Pain Prevalence
Data from the CDC shows that in the years between 2000 and 2018, low back pain was most prevalent in the total population of American adults in 2001 at 31.1% and least prevalent in 2007 at 25.6% [22].
Between 2009 and 2018, the prevalence of low back pain was greater than or equivalent to 28% [22].
Low back pain prevalence noticed a decrease of 7.07% or 2.2 percentage points between 2001 and 2011. This is followed by an increase of 3.46% or 1 percentage point from 2011 to 2018.
So, between 2001 and 2018, low back pain saw an overall decrease of 3.86% in prevalence or a total of 1.2 percentage points.
By Number of Adults Affected
The year 2018 has the highest number of American adults affected by low back pain at 75.8 million, and 2002 has the lowest at 56.7 million adults [22].
In 2015, 73.6 million American adults were affected by low back pain, which makes it the second year with the highest number of individuals affected.
Who Is Most Affected by Back Pain?
According to data from the National Center for Health Statistics, women are more likely to suffer from back pain, and back pain is more prevalent among people aged 75 and older [22].
Percentage of people affected by low back pain by sex, age, race and ethnicity, and occupation:
By Sex
31.6% of females have back pain compared to 28% of males [22]. Females are more likely to suffer from back pain compared to males. Multiple studies attribute this to complex biological, psychosocial, and sociocultural factors [32].
By Age
37.3% of people aged 75 and over have back pain, followed by 36.5% of older people aged 65 to 74 [22]. This is attributed to aging, which may result in pain that restricts social and physical function and deterioration of the musculoskeletal system [32].
The age group with the lowest percentage of back pain is adults aged 18 to 44 at 24.4%, compared to adults aged 45 to 64 at 33.0% [22].
By Race and Ethnicity
American Indians or Alaska Natives suffer the most lower back pain than other races and ethnicities at 36.0%, while Asians suffer the least with 20.1% [22].
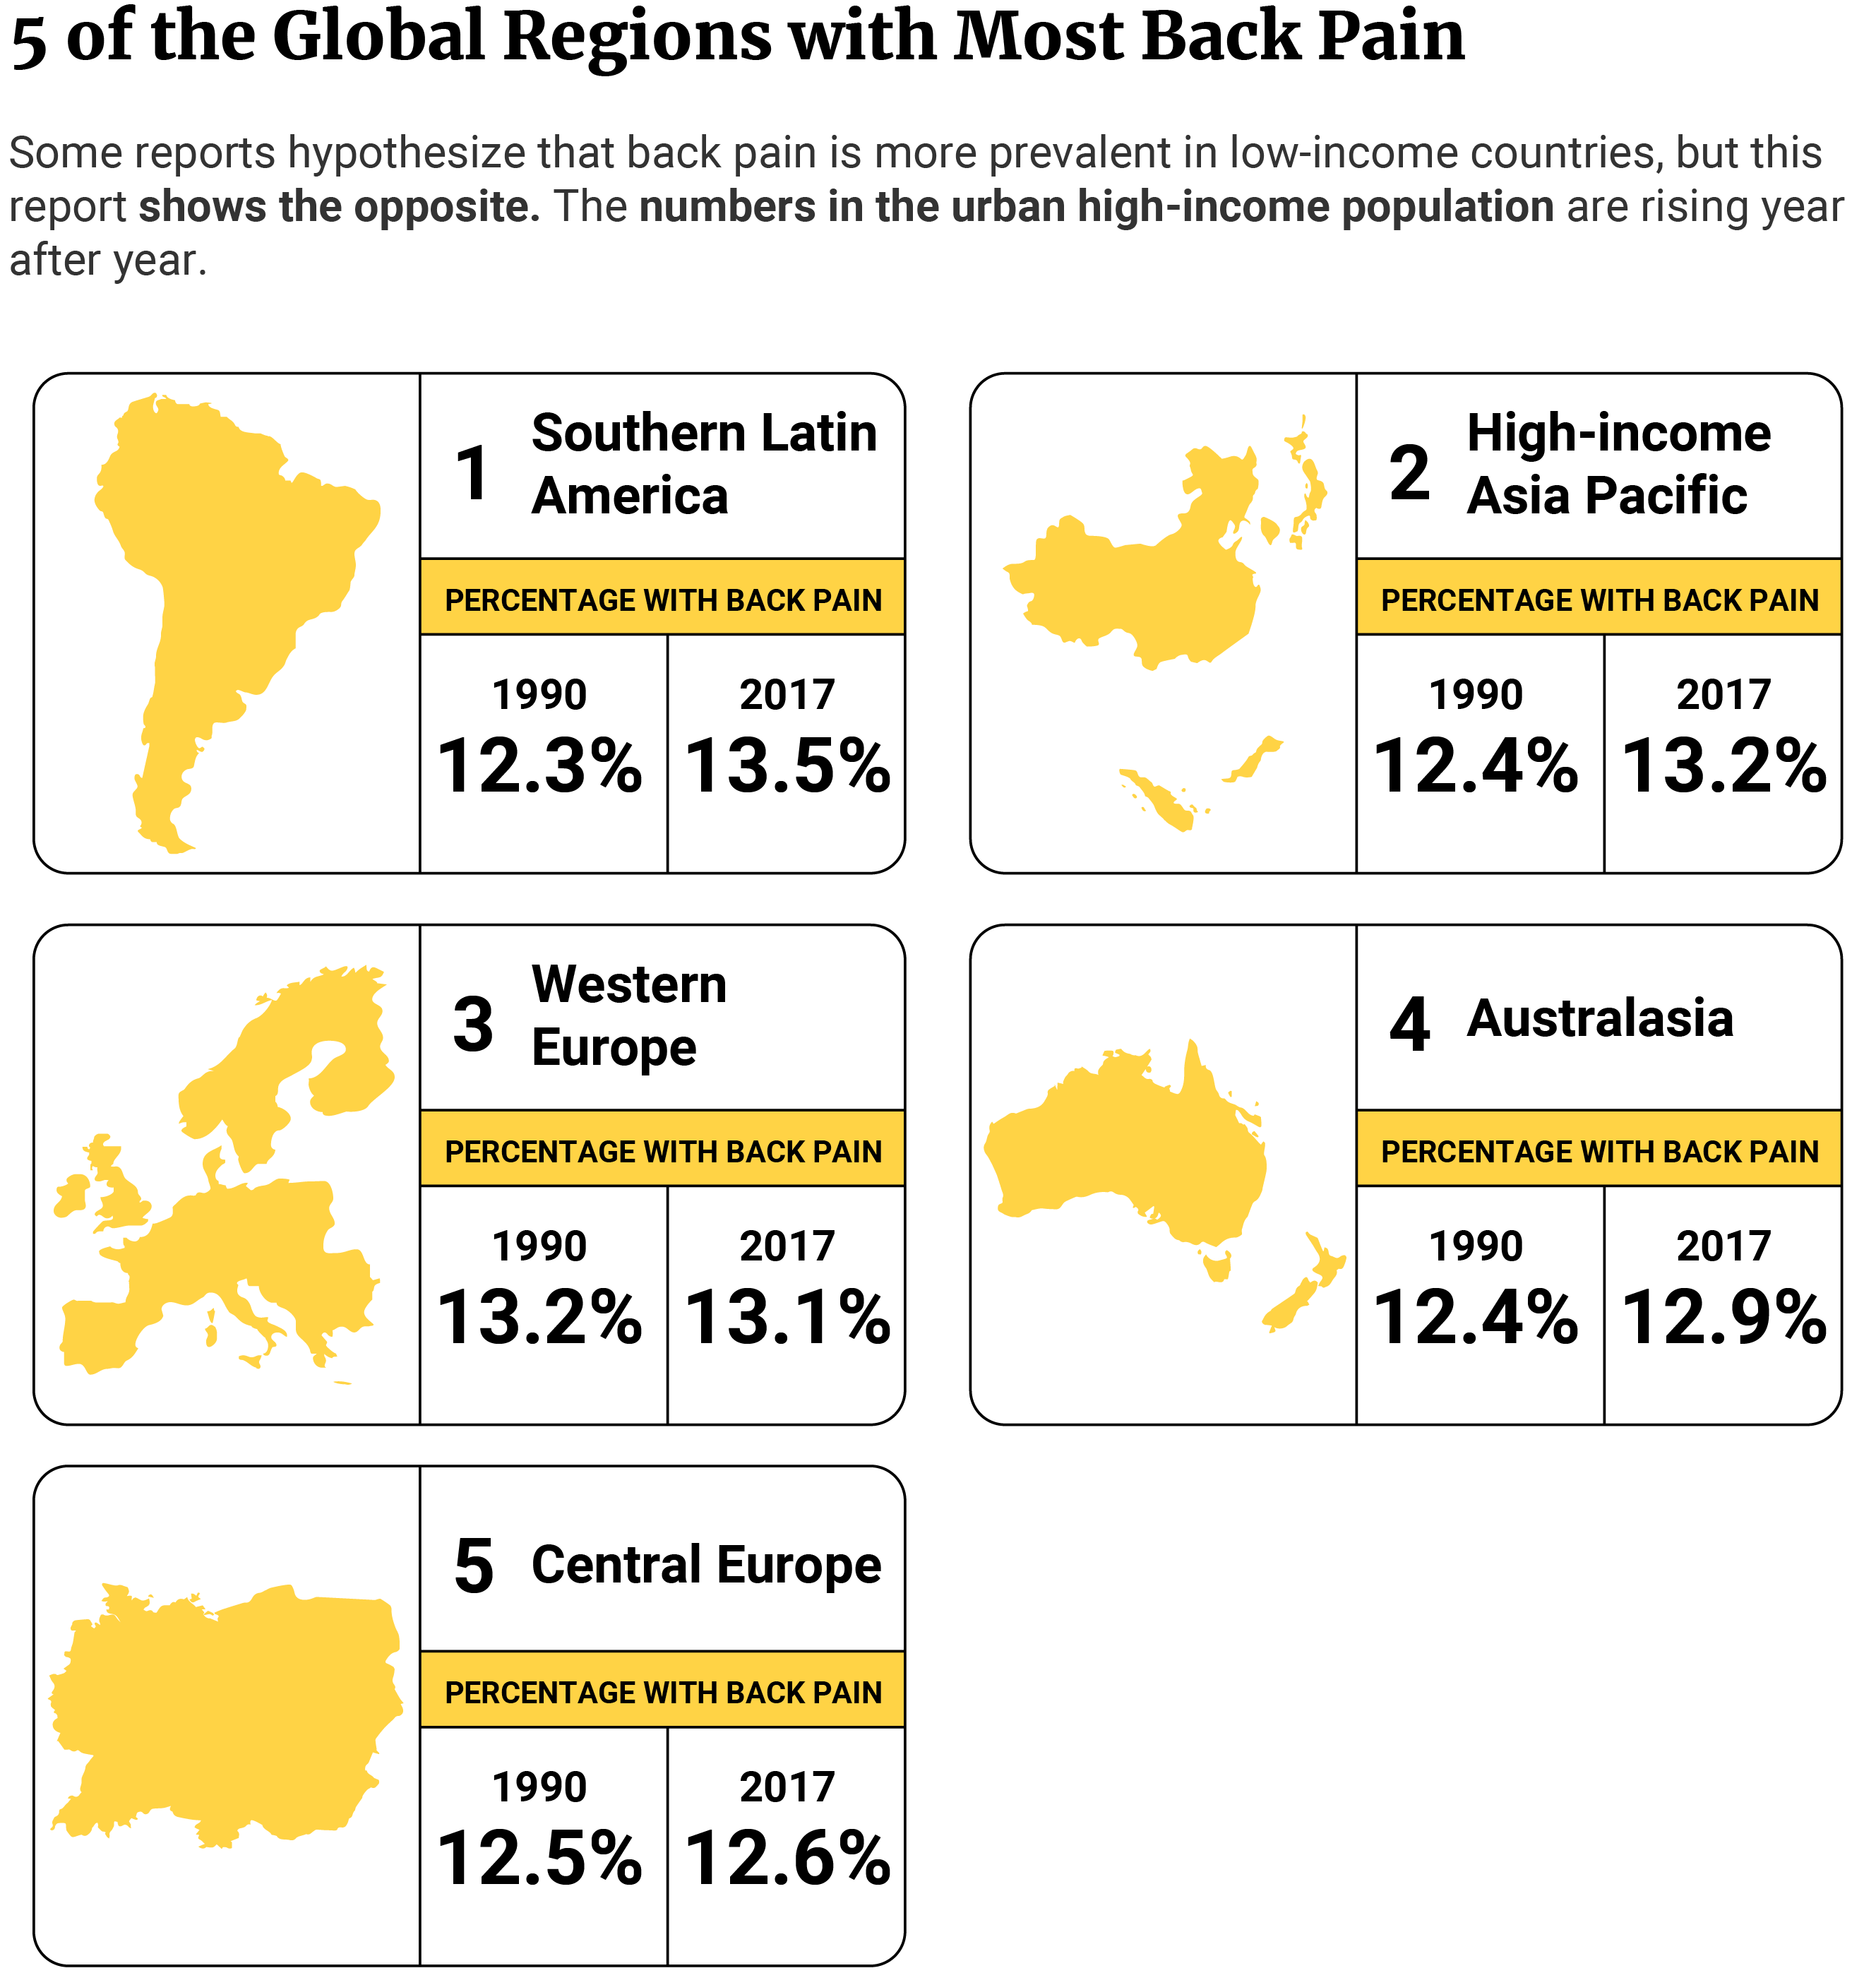
Which Region Has The Highest Percentage of Back Pain?
In 2017, Southern Latin America had the highest low back pain prevalence globally at 13.47%.
The second most prevalent global region was high-income Asia Pacific at 13.16%, which had noticed an increase of 6.5% or a 0.8 percentage point since 1990 [32].
Out of the 5 global regions with the most back pain in 2017, the only region that has seen a decrease in prevalence of back pain compared to the year 1990 is Western Europe. In 2017, Western Europe noticed a prevalence of low back pain of 13.12%, which is a decrease of 0.91% or 0.12 percentage point compared to the year 1990 [32].
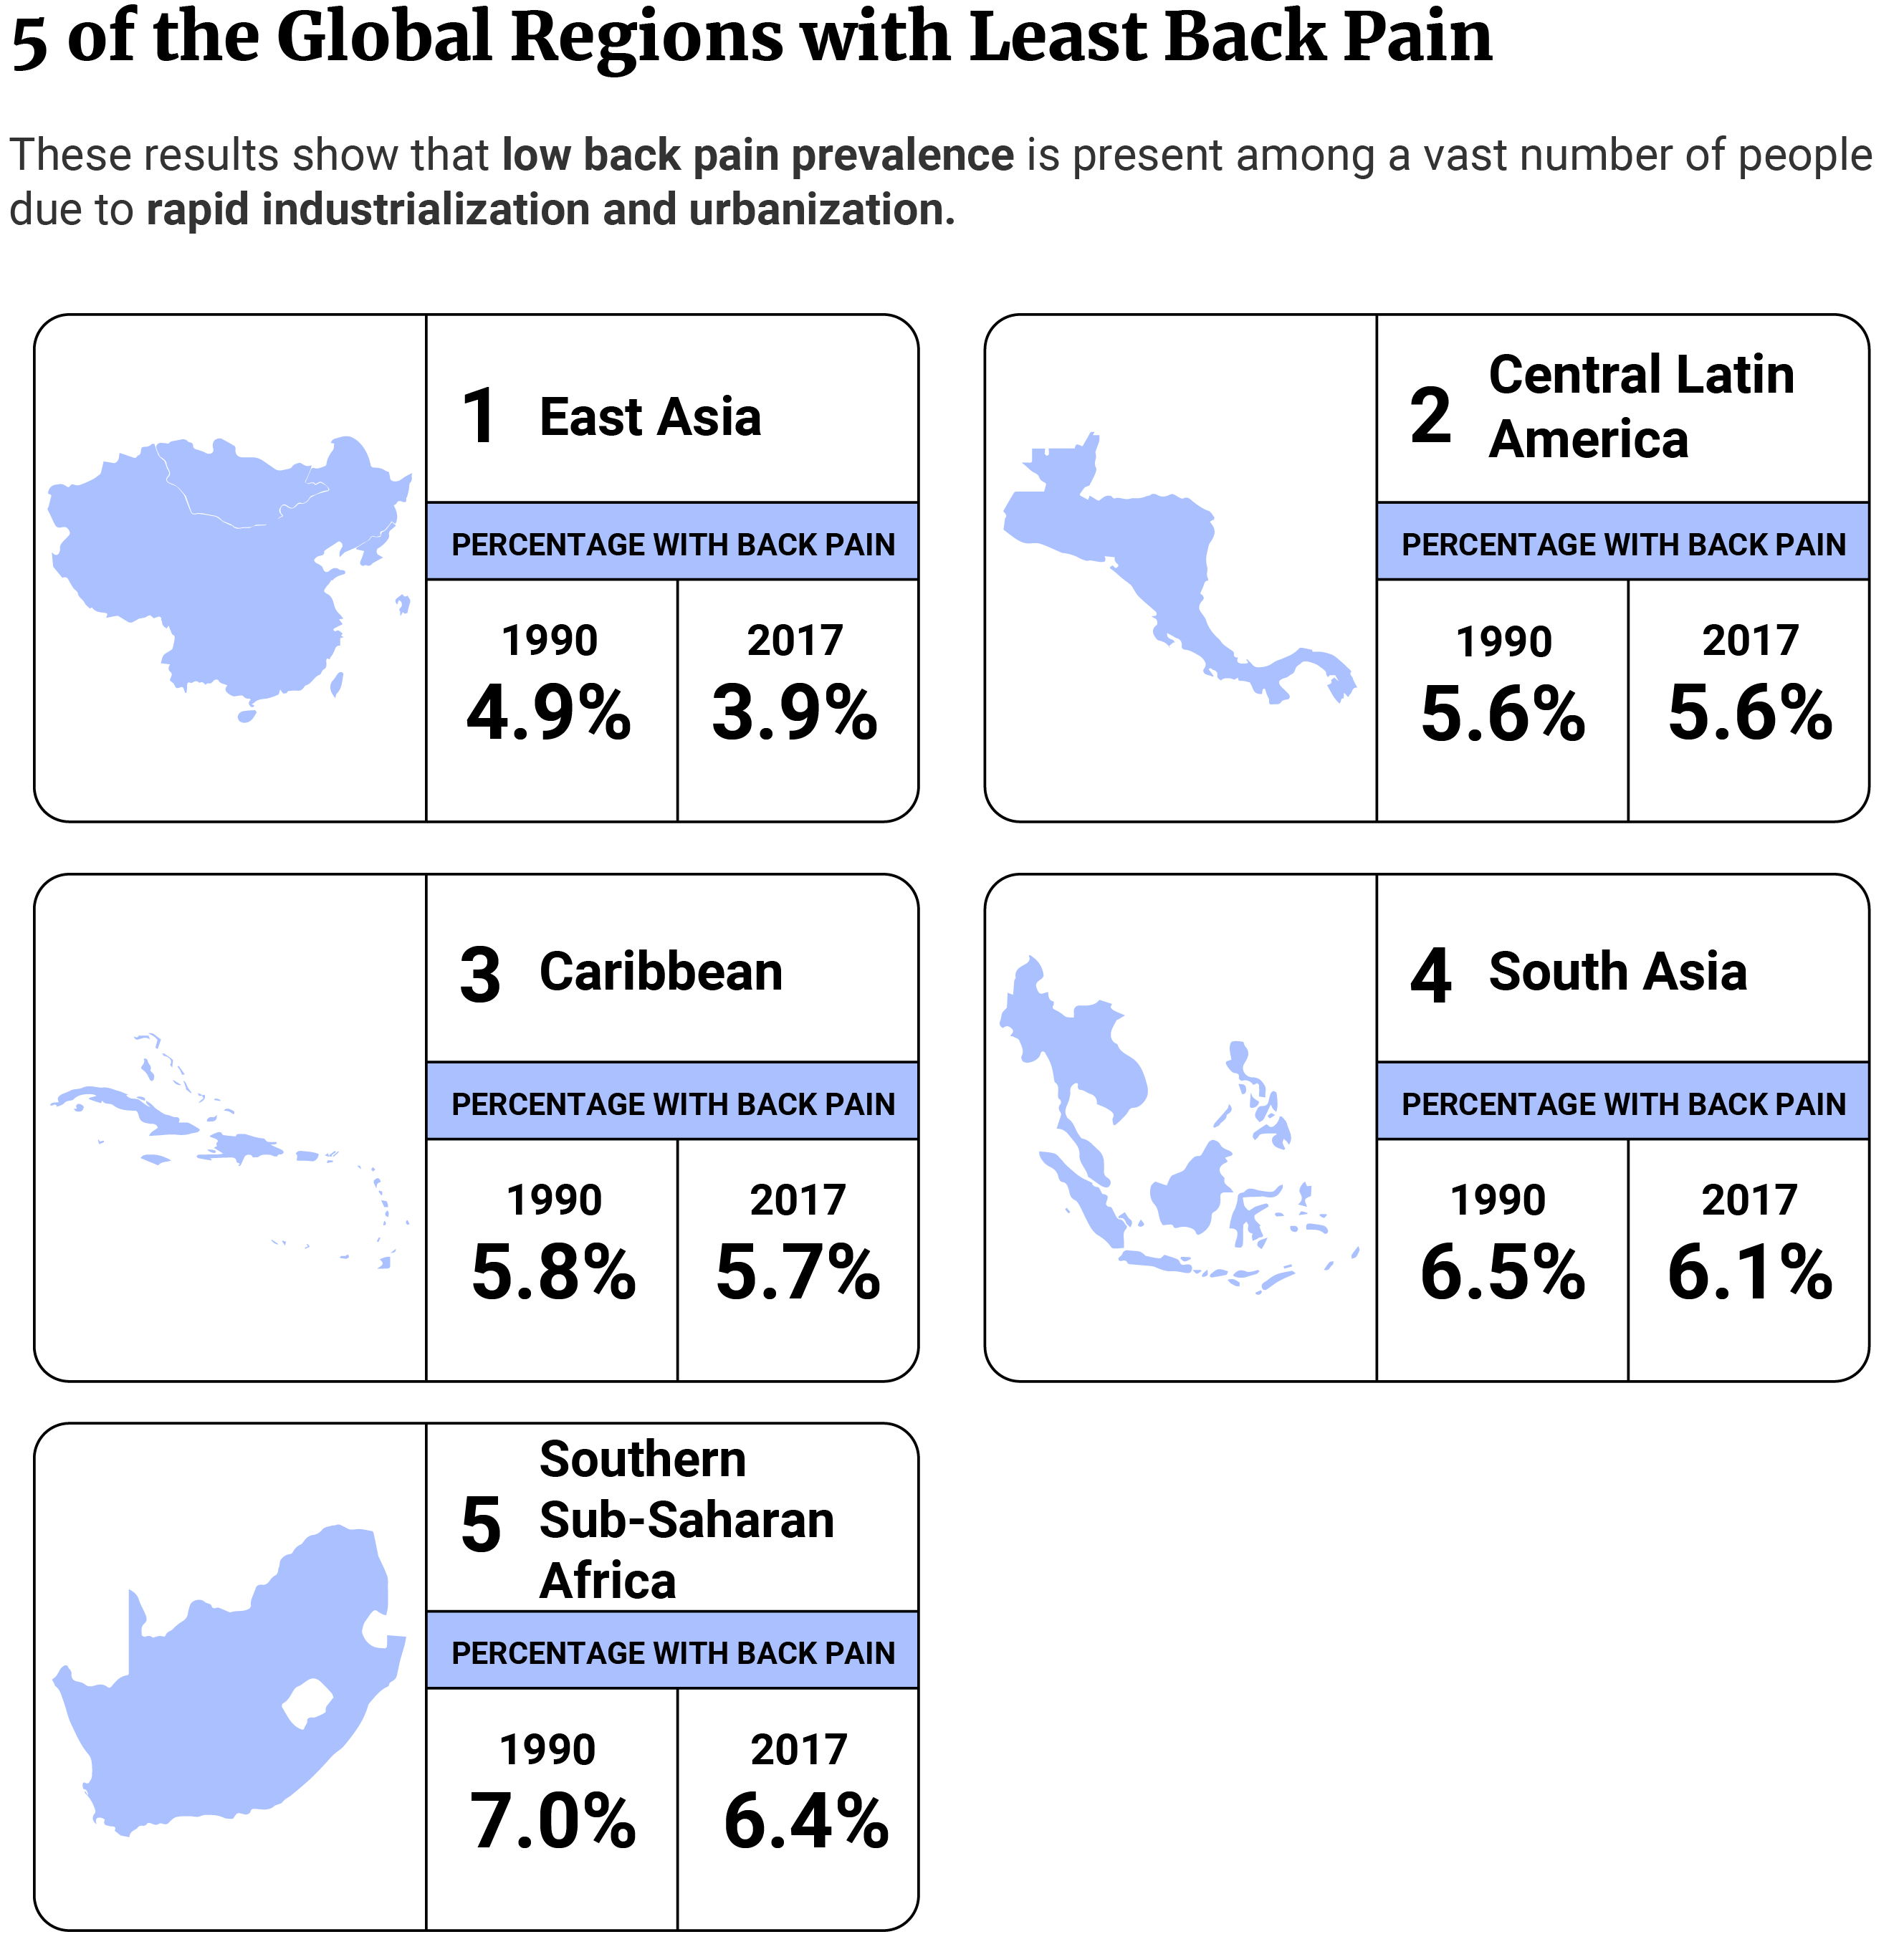
Which Region Has the Lowest Percentage of Back Pain?
In 2017, East Asia had the lowest low back pain prevalence globally at 3.92%, followed by Central Latin America at 5.62%.
Out of the 5 global regions with the lowest back pain prevalence in 2017, only Central Latin America has seen an increase in prevalence of back pain compared to the year 1990. In 2017, Central Latin America noticed a prevalence of low back pain of 5.62%, which is an increase of 0.5% or 0.03 percentage point compared to the year 1990 [32].
Prevalence of Injuries That Involve the Back Globally
Out of 1.71 billion people living with a musculoskeletal condition worldwide, the primary burden falls on low back pain, with 570 million prevalent cases. According to the World Health Organization, low back pain is the leading reason for people leaving the workforce prematurely [21].
Across All Ages
Across all ages, low back pain ranked as the 13th leading cause of disability-adjusted life years (DALYs) in 1990 and 9th in 2019. In 2019, it accounted for 2.5% of DALYs [11].
Ages 10-24
In people ages 10 to 24, low back pain was the 9th most common cause of DALYs in 1990 and the 7th in 2019 [11].
Data shows that 2.8% and 3.2% of people aged 10 to 24 had this type of pain as the main cause of DALYs in 1990 and 2019, respectively.
- Between this period, there is a 0.4 percentage point increase of DALYs caused by low back pain, which is still low compared to other age groups.
People aged 10 to 24 experienced the lowest increase of low back pain as the most prevalent cause for DALYs compared to other age groups.
Ages 25-49
In people ages 25 to 49, low back pain was the 4th most prevalent cause of DALYs both in 1990 and 2019, with an increase of 33%. Low back pain was the cause of DALYs for 3.9% of people in both 1990 and 2019 [11].
Ages 50-74
In 1990, low back pain was the 8th leading cause of DALYs and ranked 6th in 2019. Low back pain was the cause of DALYs for 2.8% of people ages 50-74 in 1990 and for 3.1% in 2019 [11].
Ages 75 and older
In people aged 75 and older, low back pain was the 13th most prevalent cause of DALYs both in 1990 and 2019 [11].
Ages 75 years and older had the highest percentage change in the number of DALYs caused by low back pain even though the rank from 1990 to 2019 remained the same (13th) and noticed a 0.1 percentage point increase.
Prevalence of Injuries That Involve the Back in the U.S.
How many back injuries occur each year in the United States?
Yearly, the United States sees over 2 million back injuries, and 4 out of 5 Americans are expected to suffer a back injury during their lifetime [3].
![]()
Out of all musculoskeletal conditionsin the U.S., back pain accounts for 20% or 1 in 5 individuals [8].
Which Occupation Is Most Affected by Back Pain-Related Injuries?
In 2016, out of all work-related musculoskeletal disorders in the United States, 38.5% involved the back — or 134,550 out of 349,050 total cases [4].
Nursing assistants take the lead at 52.8% [4].
Stock clears and order fillers are the second occupation suffering from back pain at 45.7%, followed by laborers and freight, stocks, and material movers, hand at 43.0%, and maintenance and repair workers at 42.5% [4].
![]()
Low Back Pain As A Cause of YLDs
Reports show that more US residents suffer neck and back pain as they age. Experts estimate that as the incidence of falls increases, low back pain and similar musculoskeletal disorders will become an even greater burden.
Both in 1990 and 2016, low back pain was the leading cause of YLDs in the United States [28]. The percentage change in the number of YLDs from 1990 to 2016 was 24.7%, with a decrease of 12.4% in age-standardized YLDs [28].
How Much Does Treatment for Back Pain Cost?
Back pain treatment gets expensive in the long run. Together with neck pain, back pain is the costliest condition to treat in aggregate — accounting for over $100 billion in care each year [12].
According to research by the Institute for Health Metrics and Evaluation (HME), each year, back pain treatment costs private and public insurance companies nearly $77 billion and $45 billion, respectively. Patients carry a yearly out-of-pocket financial burden for its treatment of $12 billion [9].
Back injuries cost employers $10 million annually in losses [3].
When combined, direct and indirect low back pain expenses go between $85 billion and $238 billion [5].
Physical therapy is the most cost-effective treatment for low back pain — if used as a first management strategy within the first year [10].
- When used as a first management strategy within the first year of treating this condition, physical therapy could reduce health care costs by 72%.
- Patients referred to physical therapy rather than advanced imaging by their primary care doctor saw a 50% decrease in initial treatment costs for low back pain.
Perceived Efficacy of Treatments for Back Pain
Physical therapy is perceived as the most effective treatment for low back pain at 41%, followed by chiropractic care at 29% [1].
Dealing with low back pain through self-care is perceived as the least effective method at 9% [1].
![]()
What Are the Most Common Techniques to Relieve Back Pain?
Painkillers are the most used method to relieve back pain at 49% [18].
Physical rest in everyday life (32%) and specific back exercises at home (30%) are used significantly more than medical treatment by a doctor (14%) and specific back exercises in a gym (13%). Up to 7% of people don’t use any of the common techniques for treating back pain [18].
Is CBD Effective for Chronic Back Pain?
People use CBD for conditions like back pain, nerve pain, and fibromyalgia. One survey of patients suffering from chronic pain showed that, among the patients who used CBD for their pain, those with back pain were helped the most at 67.3% [26].
How Many Back Pain Sufferers Find Relief?
According to the European guidelines for the management of low back pain, 90% of patients with acute low back pain take six weeks to recover [19].
In contrast, some reputable cohort studies estimate that short-term recovery happens in 39% to 76% of patients with acute low back pain [19].
- Studies show that 39.9% of people with an acute type of low back pain have the cumulative probability of being pain-free by 6 weeks [14].
- The number increases at 58.2% by 3 months [14].
- By 1 year, 72.5% of people with low back pain had the cumulative probability of being pain-free [14].
The cumulative probability of having no disability after suffering from back pain was 54.9% by 6 weeks, 73.3% by 3 months, and 83.3% by 1 year [14].
The studies concluded that both pain and disability swiftly improve within weeks. People reported a reduction of 58% of initial scores within the first month — with common recurrences [19].
More Than Half of Patients Recover Their Work Capability After Having Back Pain
- 24.4% or 39 of 160 patients recovered their work capability at 1 month, while 56.7% recovered their work capability at 6 months [15].
- 78.5% or 84 of 107 patients recovered their work capability at 1 year and 6 months [15].
How Common is Recurrence of Low Back Pain?
Recurrence of low back pain is very common. Numbers show that 69% or nearly 7 in 10 individuals have recurrent back pain within 12 months after recovery [7].
![]()
Risk factors like awkward posture, long time sitting and having had more than two previous episodes contribute to the recurrence of pain affecting the lower back.
Within 12 months after recovery [7]:
- 69% of participants with low back pain had a recurrence of an episode of pain.
- 40% of participants experienced a recurrence of low back pain that limits activity.
- 41% of patients experienced a recurrence of low back pain that received treatment.
Fifty-six percent (56%) of people will experience a recurrence of an episode of pain affecting the lower back by 6 months after recovery. This number decreases for back pain for which healthcare was sought, with 25% of people having a recurrence [7].
Final Thoughts: Back Pain Statistics
Back pain is a leading cause of work limitations globally. One out of five adults experiences this condition within a year, with 32.6% of females being more likely to suffer low back pain than 28% of males.
Patients perceived physical therapy as the most effective and least expensive treatment for back pain — especially if used as the first treatment option. Over half of patients recover their work capability six months after having back pain.
References
- Americans’ Perceptions of Chiropractic. (2021). Gallup-Palmer College of Chiropractic. [1]
- Back pain. (2017). National Health Service. [2]
- A Basic Plan for Preventing Back Injuries. (2020). Michigan Department of Labor. [3]
- Bureau of Labor Statistics. (2018). Back injuries prominent in work-related musculoskeletal disorder cases in 2016. The Economics Daily. [4]
- Childs, J. D., Fritz, J. M., Wu, S. S., Flynn, T. W., Wainner, R. S., Robertson, E. K., Kim, F. S., & George, S. Z. (2015). Implications of early and guideline adherent physical therapy for low back pain on utilization and costs. BMC Health Services Research, 15. [5]
- Citko, A., Górski, S., Marcinowicz, L., & Górska, A. (2018). Sedentary Lifestyle and Nonspecific Low Back Pain in Medical Personnel in North-East Poland. BioMed Research International, 2018. [6]
- da Silva, T., Mills, K., Brown, B. T., Pocovi, N., de Campos, T., Maher, C., & Hancock, M. J. (2019). Recurrence of low back pain is common: a prospective inception cohort study. Journal of Physiotherapy, 65(3), 159–165. [7]
- Department of Environmental Safety, Sustainability and Risk. (2022). Back Injuries Fact Sheet. University of Maryland. [8]
- Dieleman, J. L., Cao, J., Chapin, A., Chen, C., Li, Z., Liu, A., Horst, C., Kaldjian, A., Matyasz, T., Scott, K. W., Bui, A. L., Campbell, M., Duber, H. C., Dunn, A. C., Flaxman, A. D., Fitzmaurice, C., Naghavi, M., Sadat, N., Shieh, P., . . . Murray, C. J. L. (2020). US Health Care Spending by Payer and Health Condition, 1996–2016. JAMA, 323(9), 863–884. [9]
- Fritz, J. M., Brennan, G. P., & Hunter, S. J. (2015). Physical Therapy or Advanced Imaging as First Management Strategy Following a New Consultation for Low Back Pain in Primary Care: Associations with Future Health Care Utilization and Charges. Health Services Research, 50(6), 1927–1940. [10]
- GBD 2019 Diseases and Injuries Collaborators. (2020). Global burden of 369 diseases and injuries in 204 countries and territories, 1990–2019: a systematic analysis for the Global Burden of Disease Study 2019. The Lancet, 396(10258), 1204–1222. [11]
- Guin, K. (2018). Back Pain Treatment Costs, Opioid Use Drop When Patients Seek Immediate Care. University of Central Florida. [12]
- Guthold, R., Stevens, G. A., Riley, L. M., & Bull, F. C. (2018). Worldwide trends in insufficient physical activity from 2001 to 2016: a pooled analysis of 358 population-based surveys with 1·9 million participants. The Lancet Global Health, 6(10), e1077–e1086. [13]
- Henschke, N., Maher, C. G., Refshauge, K. M., Herbert, R. D., Cumming, R. G., Bleasel, J., York, J., Das, A., & McAuley, J. H. (2008). Prognosis in patients with recent onset low back pain in Australian primary care: inception cohort study. British Medical Journal, 337(7662), 154–157. [14]
- Ibrahim, M. E., Weber, K., Courvoisier, D. S., & Genevay, S. (2019). Recovering the capability to work among patients with chronic low Back pain after a four-week, multidisciplinary biopsychosocial rehabilitation program: 18-month follow-up study. BMC Musculoskeletal Disorders, 20. [15]
- Koch, C., & Hänsel, F. (2019). Non-specific Low Back Pain and Postural Control During Quiet Standing—A Systematic Review. Frontiers in Psychology, 10. [16]
- Kunst, A. (2019a). Perceived causes of back pain among U.S. adults as of 2017. Statista. [17]
- Kunst, A. (2019b). Ways U.S. adults relieved back pain as of 2017. Statista. [18]
- Menezes Costa, L. D. C., Maher, C. G., Hancock, M. J., McAuley, J. H., Herbert, R. D., & Costa, L. O. (2012). The prognosis of acute and persistent low-back pain: a meta-analysis. Canadian Medical Association Journal, 184(11), E613–E624. [19]
- Murat, S., Dogruoz Karatekin, B., Icagasioglu, A., Ulasoglu, C., İçten, S., & Incealtin, O. (2020). Clinical presentations of pain in patients with COVID-19 infection. Irish Journal of Medical Science, 190(3), 913–917. [20]
- Musculoskeletal health. (2022). World Health Organization. [21]
- National Center for Health Statistics. (2018). National Health Interview Survey. Centers for Disease Control and Prevention. [22]
- National Institute of Arthritis and Musculoskeletal and Skin Diseases. (2017). Common Causes of Back Pain - Types & Treatment. National Institutes of Health. [23]
- National Institute of Neurological Disorders and Stroke. (2020). Low Back Pain Fact Sheet. National Institutes of Health. [24]
- Rubin, D. I. (2007). Epidemiology and Risk Factors for Spine Pain. Neurologic Clinics, 25(2), 353–371. [25]
- Schilling, J. M., Hughes, C. G., Wallace, M. S., Sexton, M., Backonja, M., & Moeller-Bertram, T. (2021). Cannabidiol as a Treatment for Chronic Pain: A Survey of Patients’ Perspectives and Attitudes. Journal of Pain Research, 14, 1241–1250. [26]
- Smoking Hurts Your Back. (2013). University of Rochester Medical Center. [27]
- The US Burden of Disease Collaborators. (2018). The State of US Health, 1990–2016: Burden of Diseases, Injuries, and Risk Factors Among US States. JAMA, 319(14), 1444–1472. [28]
- Tidy, C. (2019). Lower Back Pain. Egton Medical Information Systems Limited. [29]
- Vassilaki, M., & Hurwitz, E. L. (2014). Insights in Public Health: Perspectives on Pain in the Low Back and Neck: Global Burden, Epidemiology, and Management. Hawaii Journal of Medicine and Public Health, 73(4), 122–126. [30]
- Vinstrup, J., Jakobsen, M. D., & Andersen, L. L. (2020). Poor Sleep Is a Risk Factor for Low-Back Pain Among Healthcare Workers: Prospective Cohort Study. International Journal of Environmental Research and Public Health, 17(3), 996. [31]
- Wu, A., March, L., Zheng, X., Huang, J., Wang, X., Zhao, J., Blyth, F. M., Smith, E., Buchbinder, R., & Hoy, D. (2020). Global low back pain prevalence and years lived with disability from 1990 to 2017: estimates from the Global Burden of Disease Study 2017. Annals of Translational Medicine, 8(6), 299. [32]